You can study CPU capacity of PostgreSQL using pgbench running SELECT statements at a grid of client × size examples. You can reach a fraction of random I/O SSD speed this way on local runs. 2×–4× RAM is the recommended range to make caching of the whole data set impossible, while allowing indexes to fit easily in memory on tests that use them. A SELECT variation (select-pages) uses index range scans instead of single row lookups. That one is much better at fetching enough blocks at a time to saturate SSD. It runs based on a block multiplier (MULTI / pgbench :multiplier on one script — see wl/multis).
select-scatter-64 is the Relations-shaped miniature: unsorted random aids → nested-loop index probes and heap fetches. Batch size is fixed in the script name (select-scatter-N); setup writes matching MULTI=N into tests.multi, and benchwarmer also derives it from SCRIPT. Scripts exist for 1 / 2 / 4 / 8 / 16 / 64 (SCATTER=N via wl/arm-miss-isolation). Court set 30 ran that ladder cold/hot with coalescing off; twilight (x86) still to go — see ARM study § Next probes.
Cloud tests running simple SELECTs mainly measure latency between the client and server. Since some queries return cached data very fast, reviewing the minimum latency observed tracks very well with connection latency.
Each client count also gets transactions per joule from the 1-second package-power integral — energy efficiency as the other side of that TPS fan. See the SELECT leaderboard.
Protocol and preparation faces
Developers working on PostgreSQL itself often run benchmarks on their server workstation. For queries on the server, all the overhead of standard IP networking can be avoided if clients use the UNIX sockets connection method instead. Those rates can easily clear 1M TPS on single modest desktop processor, representing fantasy speeds no regular client will see. That load is useful for people working on the database’s internals.
pgbent provides tools to allow comparing the same SELECT run simple or prepared, and with either the default localhost TCP or with sockets, referred to here as the four connection faces. Sweeping all four faces (sockets vs localhost TCP, simple vs prepared) provides a connection study. Those are still ran regularly here as a regression code, so a method or preparation change doesn’t obscure real results.
wl/select-faces runs the sweep. These are intended to be comparable to the pgbench numbers published at OpenBenchmarking.org pts/pgbench (Phoronix Test Suite). Phoronix switched to -M prepared a few years ago (PTS pgbench 1.13) and that reset the public history for a lot of viewers. The numbers went up — query planning in Postgres takes time — but that wasn’t a real gain in the software under test. Localhost TCP prepared is the Phoronix-shaped ranking cell on the SELECT leaderboard; this lab still publishes all four faces so a method change cannot hide. The PG18 connection study made that method public. OpenBenchmarking’s multi-million TPS numbers are multi-socket systems on DC network hardware, not localhost and not unix sockets sharing the server with pgbench.
Simpler scripts
The standard pgbench SELECT runs an indexed lookup. There are some fantasy scripts available in the tests to break that down further. SCRIPT=nothing (tests/nothing.sql) is only ; — protocol and BEGIN/COMMIT, no query. SCRIPT=constant (tests/constant.sql) is SELECT 1; — a query with no table lookup. The accounts SELECT then layers its lookup on top of that. Same connection face options. On 9950X sockets nothing hits 280K TPS on a single client prepared or simple. Sockets simple constant is 179,635. That’s web scale! think is the other end of that axis, it adds sleep. wl/empty-grid writes the nothing params. You can either regenerate the pgbench database itself each run set, or run against an existing scale-100 database with SKIPINIT=1.
The four SELECT faces plus sockets ; / SELECT 1 ran on siren, an AMD R9 9950X, for 19rc1 (set 107), scale 100, 90s. At 32 clients, sockets prepared SELECT is 2.06M; sockets ; is 4.05M — take the executor out and the rate almost doubles. SELECT 1 prepared (2.96M) sits between them. 19rc1 snapshot: pgbench SELECT.
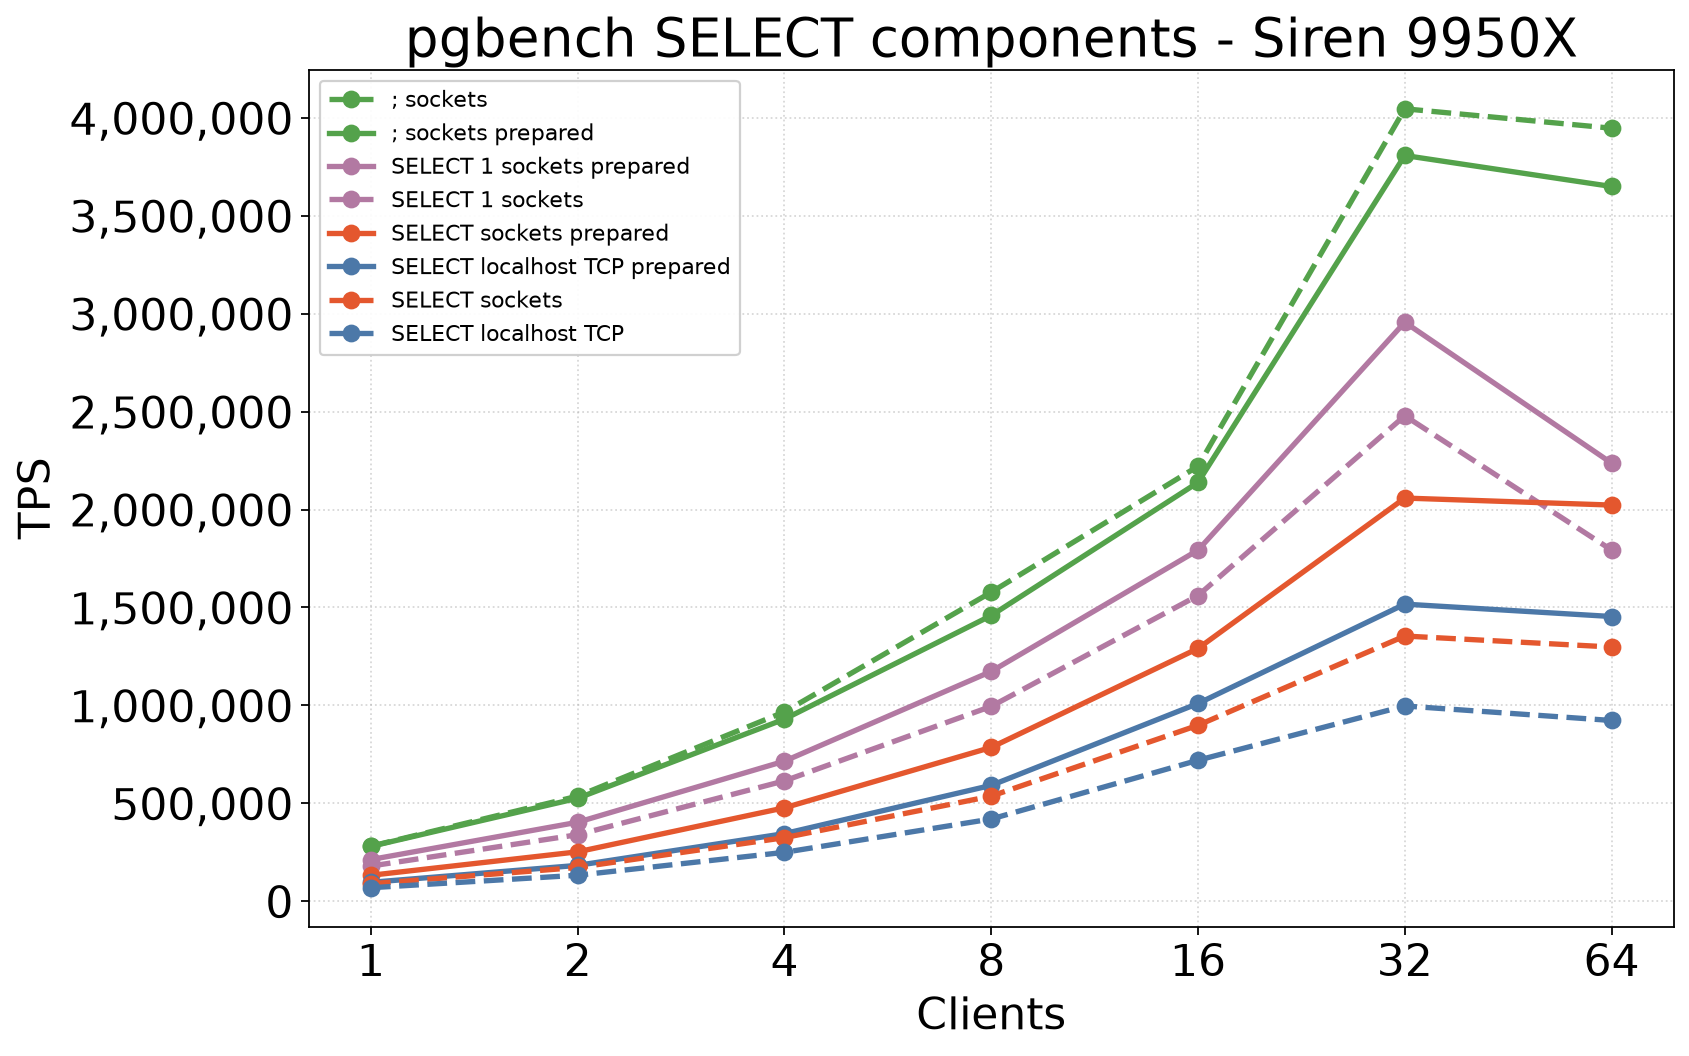
Simple (not prepared) query is the fastest way to do nothing (;). The prepared path is still doing protocol work with no plan to amortize it over. You’re paying for Bind/Execute steps instead of just spending those cycles on another empty nothing-results trip.
1-client latency pieces
At one client these rates represent the inverse of the latency times. Planning takes some amount, execution some, and the connection method adds some. The empty ; floor, both SELECT 1 faces, and the four SELECT faces on siren 19rc1 (set 107) split that:
| 1-client cell | TPS | 1/TPS |
|---|---|---|
sockets ; | 281,019 | 3.6 μs |
sockets prepared ; | 280,201 | 3.6 μs |
sockets prepared SELECT 1 | 212,745 | 4.7 μs |
sockets SELECT 1 | 179,635 | 5.6 μs |
| sockets prepared SELECT | 132,433 | 7.6 μs |
| localhost TCP prepared | 96,566 | 10.4 μs |
| sockets | 89,241 | 11.2 μs |
| localhost TCP | 68,924 | 14.5 μs |
- Protocol +
BEGIN/COMMIT: 3.6 μs from sockets;. No query. Prepared 280,201 vs simple 281,019 — same floor; preparation does not move an empty transaction. - Execute
SELECT 1: +1.1 μs, sockets preparedconstant(212,745) minus sockets prepared;. A query, no table, plan skipped. - Plan
SELECT 1: +0.9 μs, sockets simpleconstant(179,635) minus sockets preparedconstant. Trivial plan; preparation does help here. - Lookup: +2.9 μs, sockets prepared SELECT minus sockets prepared
constant. The accounts row on top of an already-planned query. - Planning the accounts SELECT: +3.6 μs, sockets simple minus sockets prepared. Heavier plan than
SELECT 1. - TCP Connection: +2.8 μs, localhost TCP prepared minus sockets prepared. Already-open pgbench session — not
connect(). Initial connect is a one-time pgbench line, not in these TPS numbers.
Protocol + execute + lookup + accounts planning + TCP is 14.0 μs against 14.5 μs on localhost TCP simple. Close enough to account for the cell. The old mixed +2.0 μs (SELECT 1 simple minus ;) is plan + execute (0.9 + 1.1). The old mixed +4.0 μs (prepared SELECT minus prepared ;) is execute + lookup (1.1 + 2.9). Multi-client TPS is the same latencies with more pipelines, not a different clock.
Sockets nothing on siren 19rc1 (set 107, 90s, scale 100) peak is 4.05M simple at 32 clients (tests 3254 / 3251). SELECT’s sockets-prepared peak on the same box is 2.06M at 32; ; is already past that at 16.
| clients | sockets | sockets prepared |
|---|---|---|
| 1 | 281,019 | 280,201 |
| 2 | 536,616 | 525,849 |
| 4 | 966,910 | 929,901 |
| 8 | 1,577,974 | 1,459,014 |
| 16 | 2,221,108 | 2,138,539 |
| 32 | 4,046,425 | 3,808,019 |
| 64 | 3,947,315 | 3,649,678 |
At one client they are the same 3.6 μs floor. At many clients simple stays a few percent ahead. Both go flat or down past 32, the CPU core count.
Sockets constant (SELECT 1) ran on the same set. Simple peaks 2.48M at 32 — between ; (4.05M) and prepared SELECT (2.06M). Prepared is higher: 2.96M at 32, 2.24M at 64. At 64 simple falls to 1.79M (avg 34 μs, P90 46 μs, max 52 ms); prepared stays ahead (avg 27 μs, P90 38 μs, max 623 ms). Preparation helps SELECT 1 at every client count; it does not help ;.
| clients | sockets SELECT 1 | sockets prepared SELECT 1 |
|---|---|---|
| 1 | 179,635 | 212,745 |
| 2 | 339,650 | 403,393 |
| 4 | 614,640 | 715,299 |
| 8 | 995,009 | 1,173,454 |
| 16 | 1,561,063 | 1,792,701 |
| 32 | 2,478,846 | 2,956,507 |
| 64 | 1,793,332 | 2,237,216 |
pgbent’s own summary breaks down at the high end of these rates. On reference test 3252 (; sockets prepared, 64 clients, 3.65M TPS, avg 7 μs), The P90 0-built with a 20-bucket OFFSET on 328M rows-did not finish, and the max latency observed by pgbent was 1,448,031 μs (1.45 s). That’s not just a connect() blip. The per-row latency.png demonstrates why every -l line is copied: the floor is still microseconds (invisible on a 1600 ms axis) and the 200 ms–1.5 s stalls repeat through the file, including that 1.45 s point. It’s not one artifact and it’s not just one of the startup/shutdown blips that happen sometimes either. This class of overloaded scheduler latency artifacts are why pgbent still has this heavy processing ingest phase analyzing latencies, those blips have been there since this project started in 2007.
Comparing versions
Hold conn_method constant, if you’re comparing different connection faces that will look like a regression of ~25%. Scale 100 is about 1.6GB; that SELECT stays in memory, so a disk swap between pins does not matter.
On 19rc1 the whole connection faces grid was run: sockets vs localhost TCP, simple vs prepared. 90s, 32 clients, mean of two SETTIMES:
| pin | conn_method | TPS |
|---|---|---|
| PostgreSQL 18.3 | sockets prepared | 2,013,812 |
| PostgreSQL 19rc1 | sockets prepared | 2,058,653 |
| PostgreSQL 19beta4 | localhost TCP prepared | 1,500,701 |
| PostgreSQL 19rc1 | localhost TCP prepared | 1,517,063 |
19 took the ranking cell with a tiny delta over 18 on sockets, and a similarly small step over 19beta4 on localhost TCP. The four-face SELECT leaderboard is that RC grid: sockets prepared 2.06M vs localhost TCP prepared 1.52M, a flat ~26% from 1 client through 64. At 1.5M TPS that protocol gap is not really bad. Snapshot of the same board: pgbench SELECT (PG19).