OSM Leaders: Performance vs. Power
Disk and package-power detail behind the OSM leaderboard.
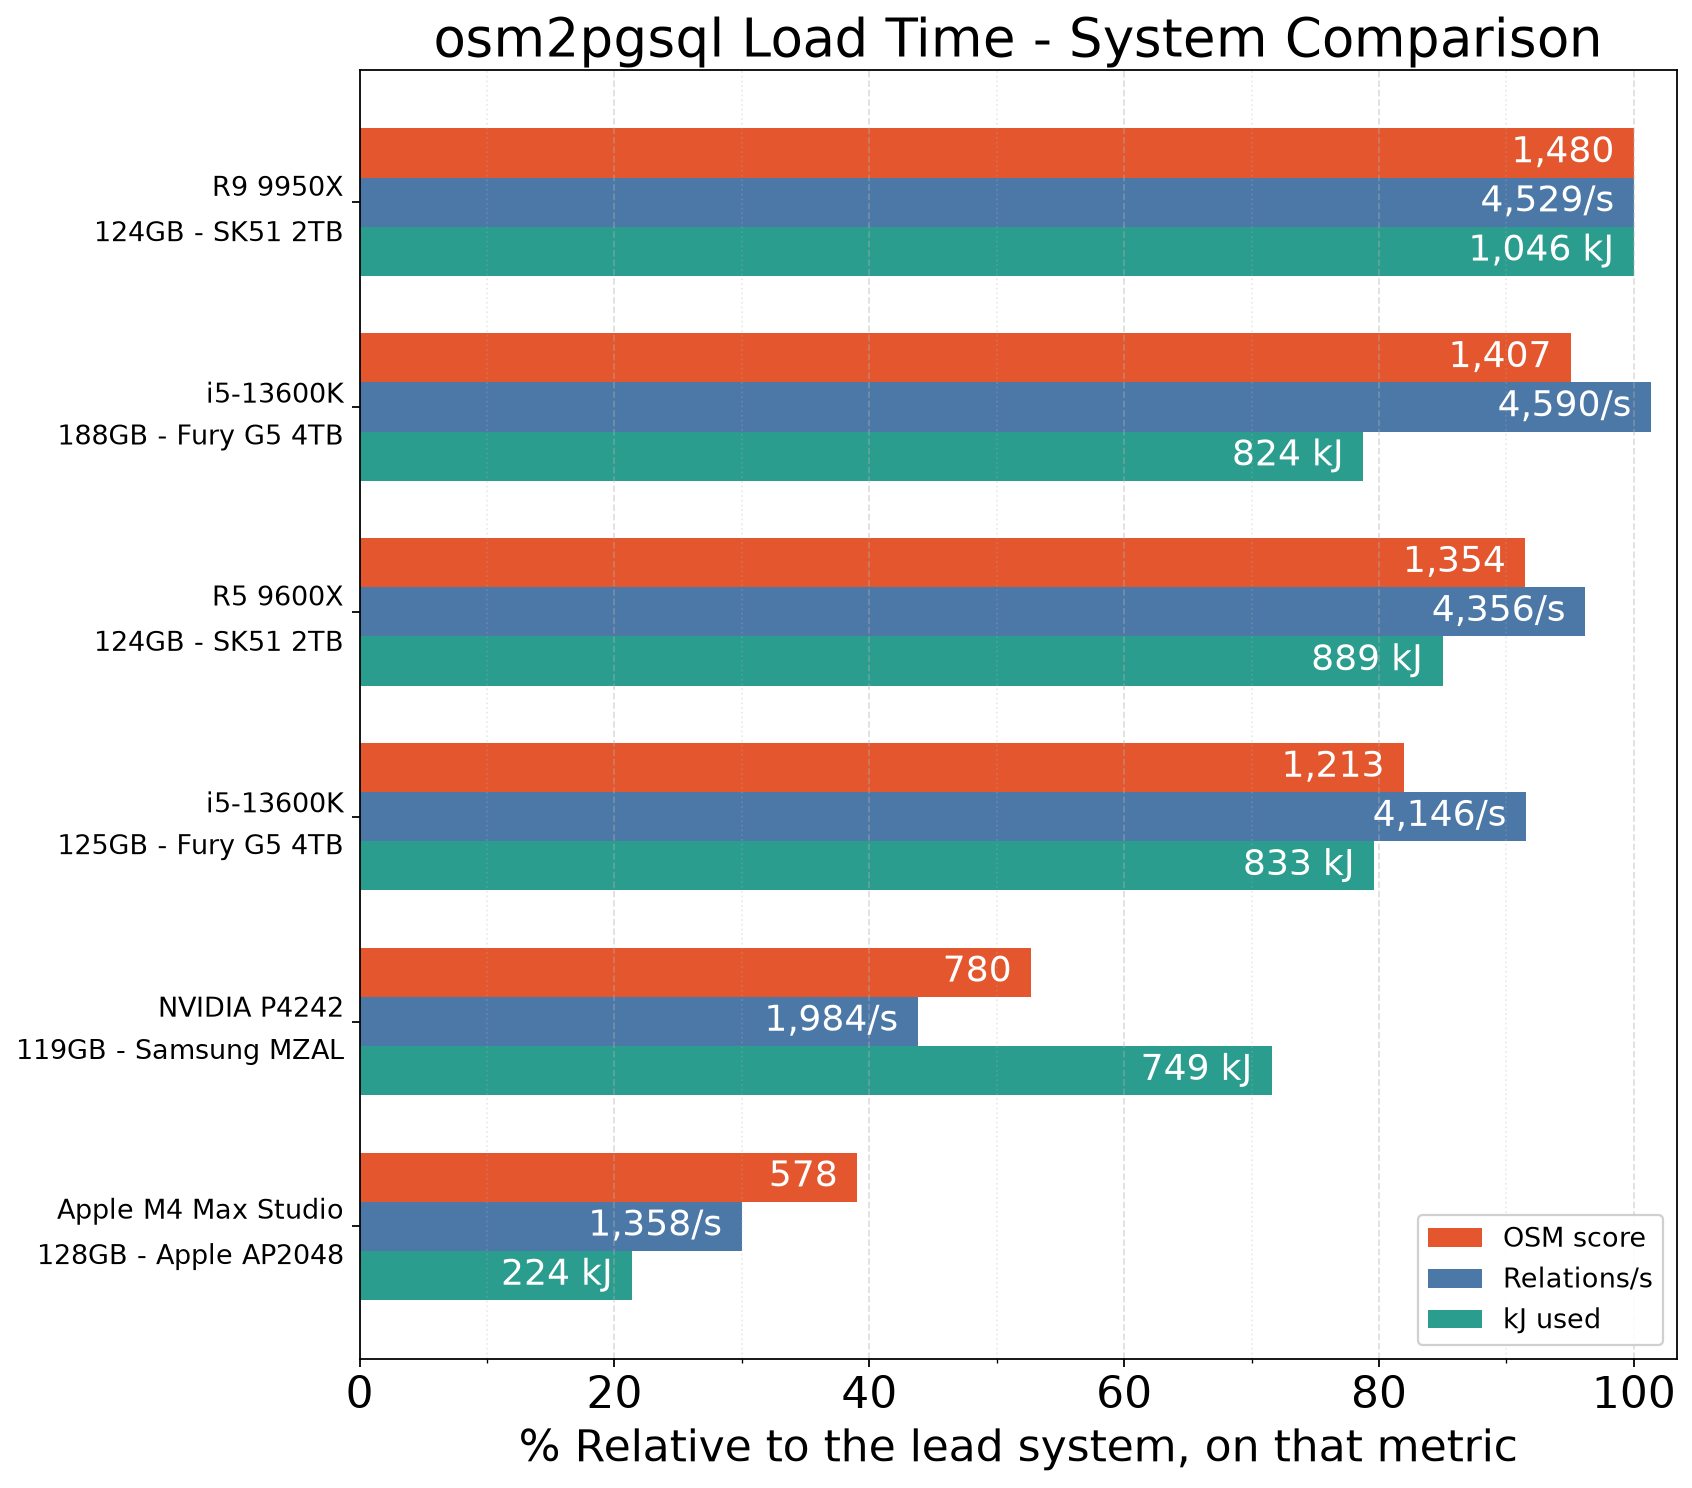
One chart for the same best-score run on each machine, sorted by OSM score. Bar length is relative to the lead system, on that metric (100% = that system’s value). Labels are the raw values. A longer kJ bar means more energy used, not more efficiency.
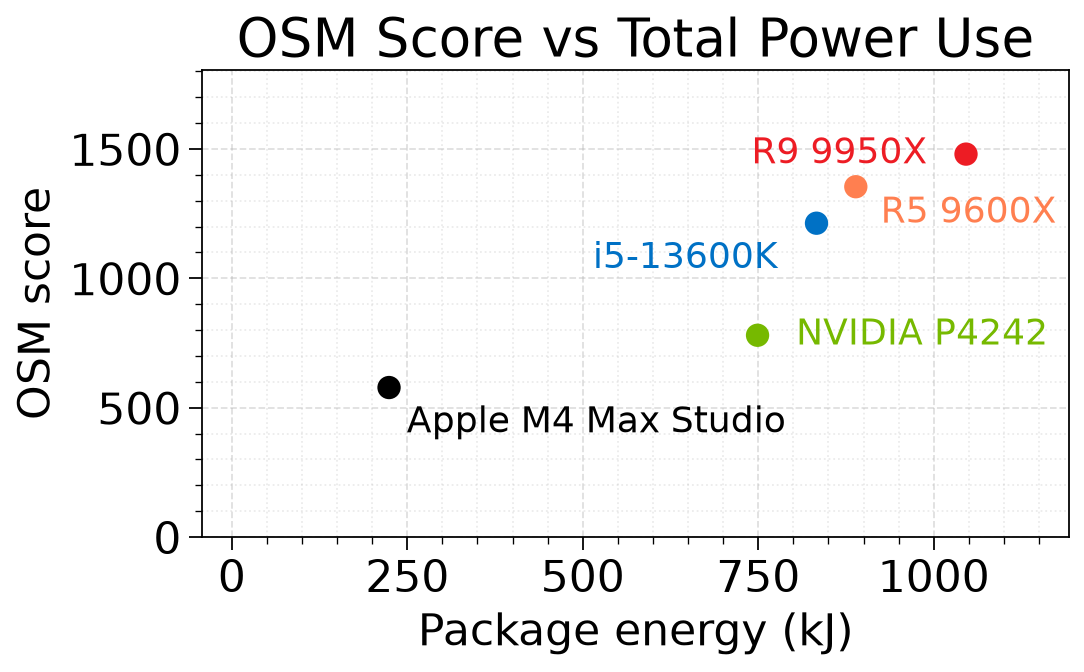
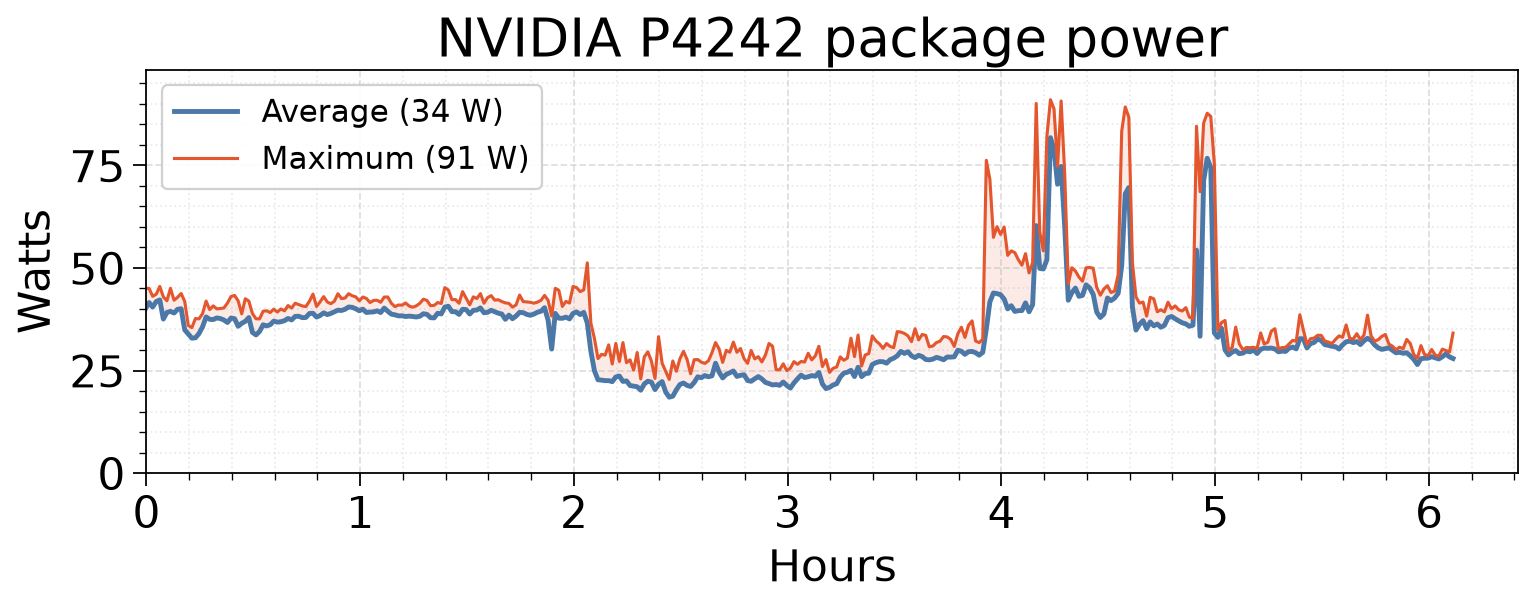
Speed vs energy for the best run on each machine at ~128GB RAM. Score is OSM kNodes/s; kJ is total package energy (joules, shown as kilojoules) from the 1-second power integral over the test window. NVIDIA DGX Spark package watts come from the open spark_hwmon module, not an NVIDIA-shipped sensor path.
R9 9950X scores 1480 at 1046 kJ; Apple M4 Max Studio scores 578 at 224 kJ (2.6× score, 4.7× joules). Versus NVIDIA Spark the score ratio is 1.9× (1480 vs 780). The wide Apple gap is mostly a Darwin desktop I/O-class clamp (LaunchAgent), not the M4 — see ARM random read vs x86.
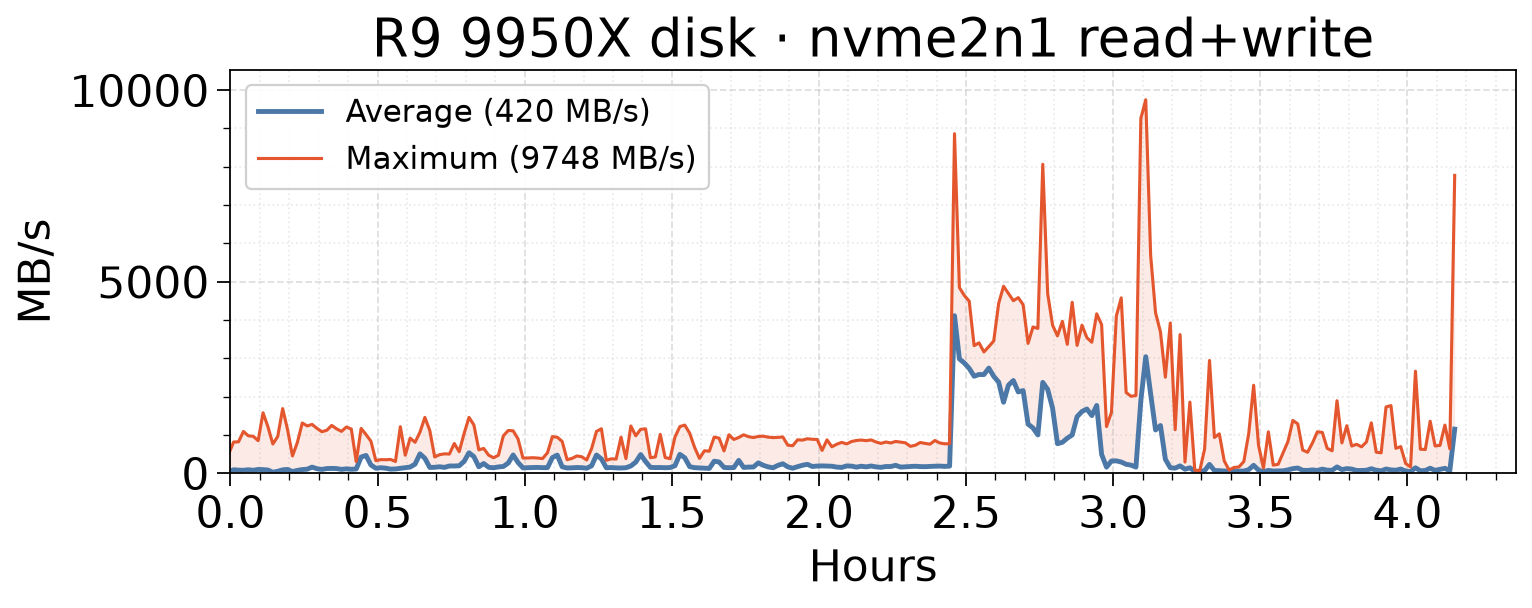
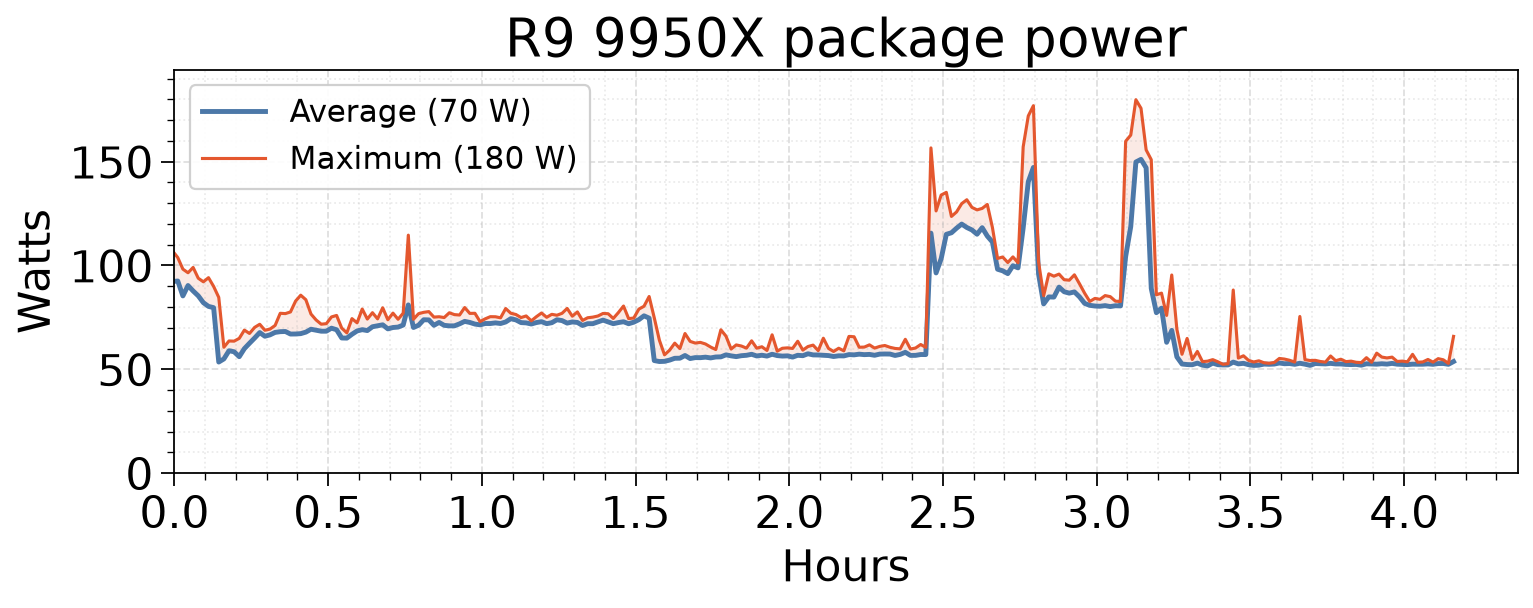
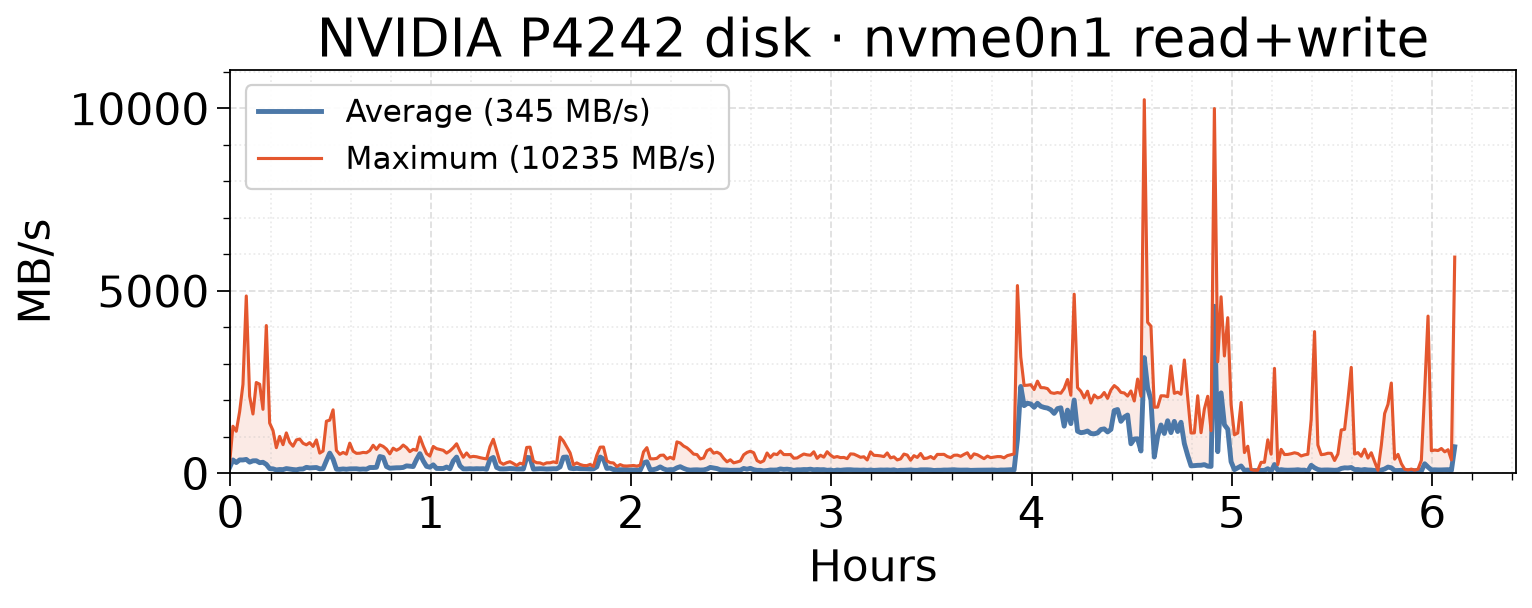
The board leader is R9 9950X (PostgreSQL 19, fsync=off, OSM score 1480). Both traces are minute buckets of the owned 1-second collectors on that run: Average is what a minute-grained sample would report; Maximum is the peak 1-second reading in that minute — the cliffs a delegated 60-second poll never stored. Disk is combined read+write on data volume nvme2n1.
The power-efficiency leader is Apple M4 Max Studio (PostgreSQL 18, fsync=off, 16.1 score/W, OSM score 561). Disk is Darwin combined throughput (disk0_MB/s); there is no read/write split.
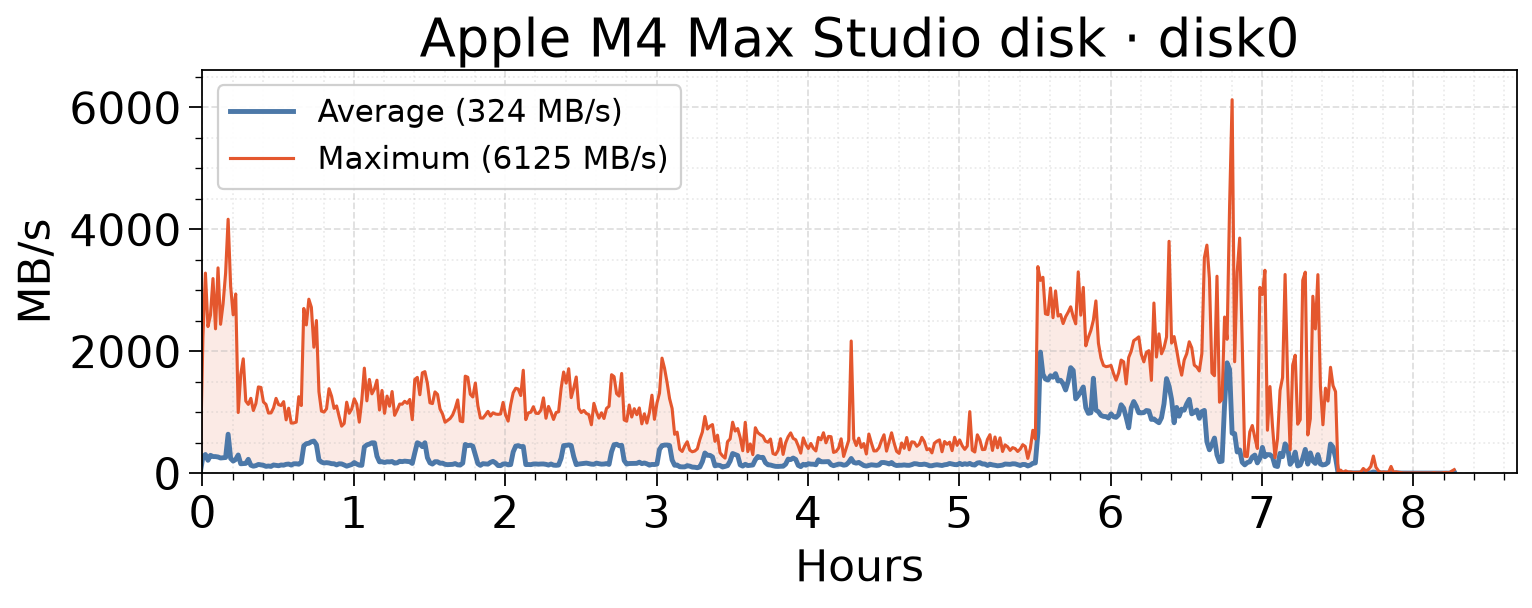
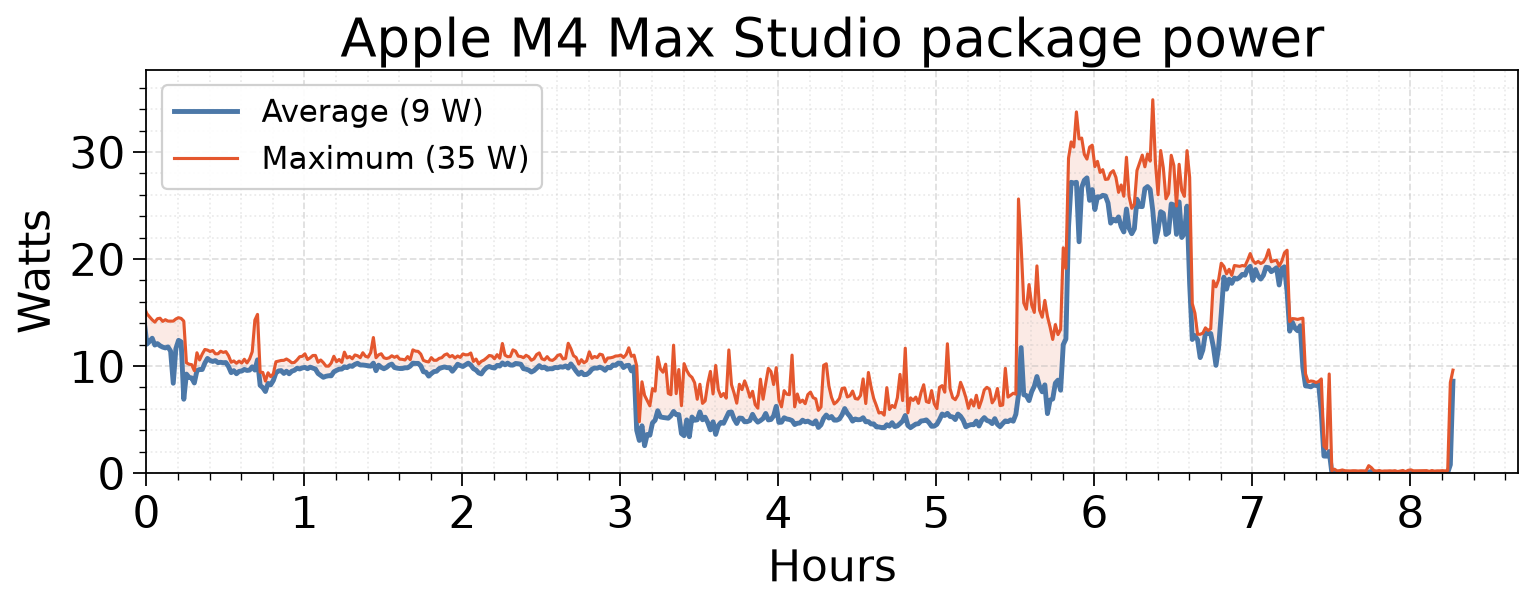
NVIDIA Spark (court, NVIDIA P4242) rounds out the set (PostgreSQL 19, fsync=off, OSM score 780, 490 kNodes/s total, 6.12h). Disk is combined read+write on data volume nvme0n1.
Regenerate: MPLBACKEND=Agg MPLCONFIGDIR="$PWD/.matplotlib-cache" .venv-graph/bin/python reports/osm-leaderboard.py --from-db (runs reports/osm-leaderboard.sql; table on /leaderboards/, disk and power here).