OSM Checkpoint
Checkpoint tuning during OSM load.
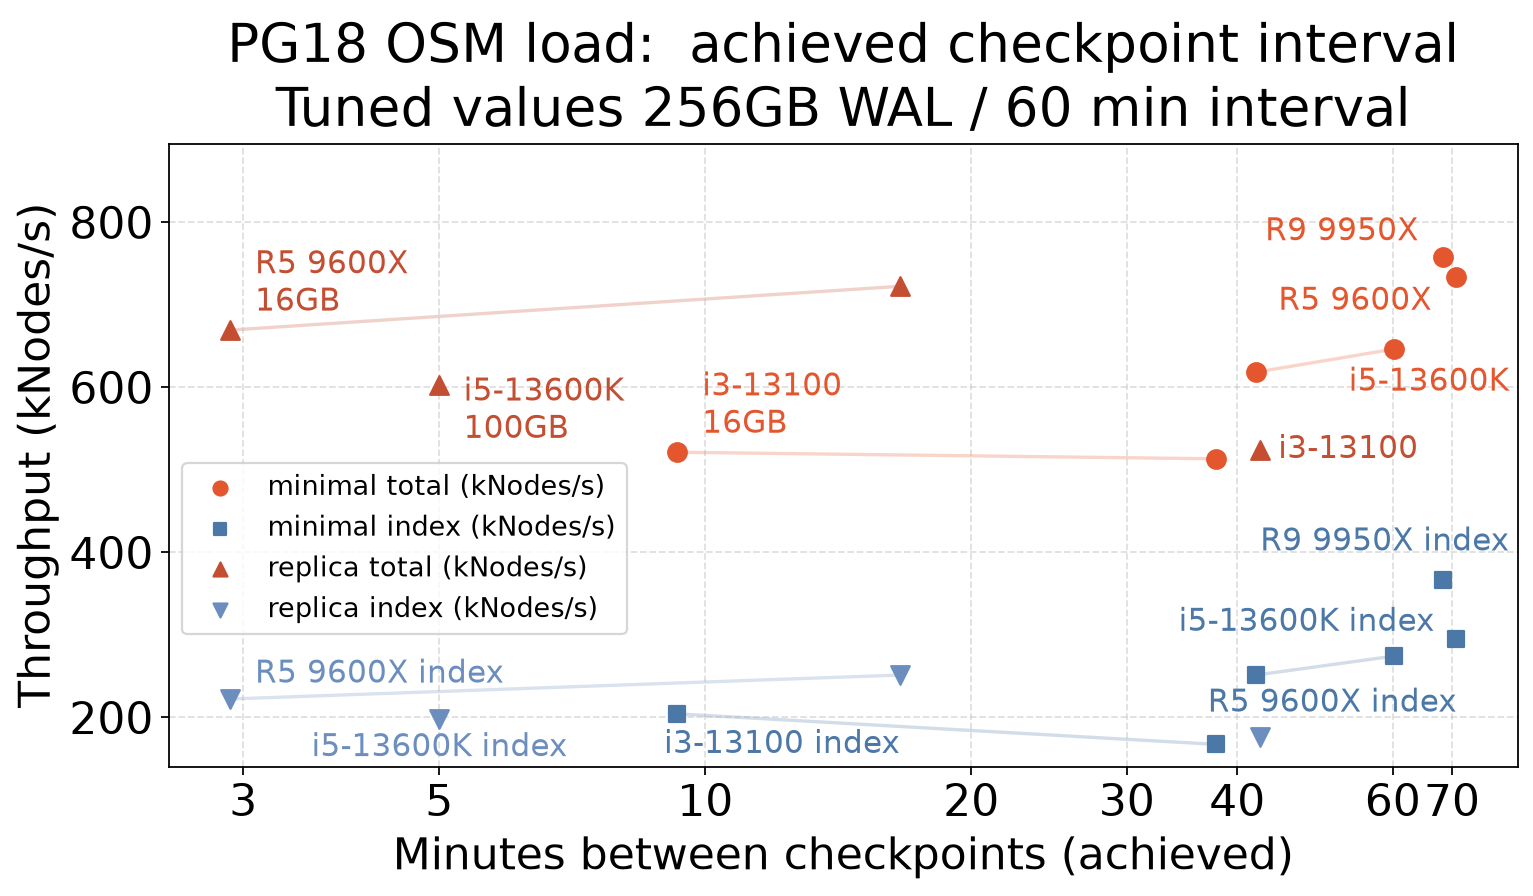
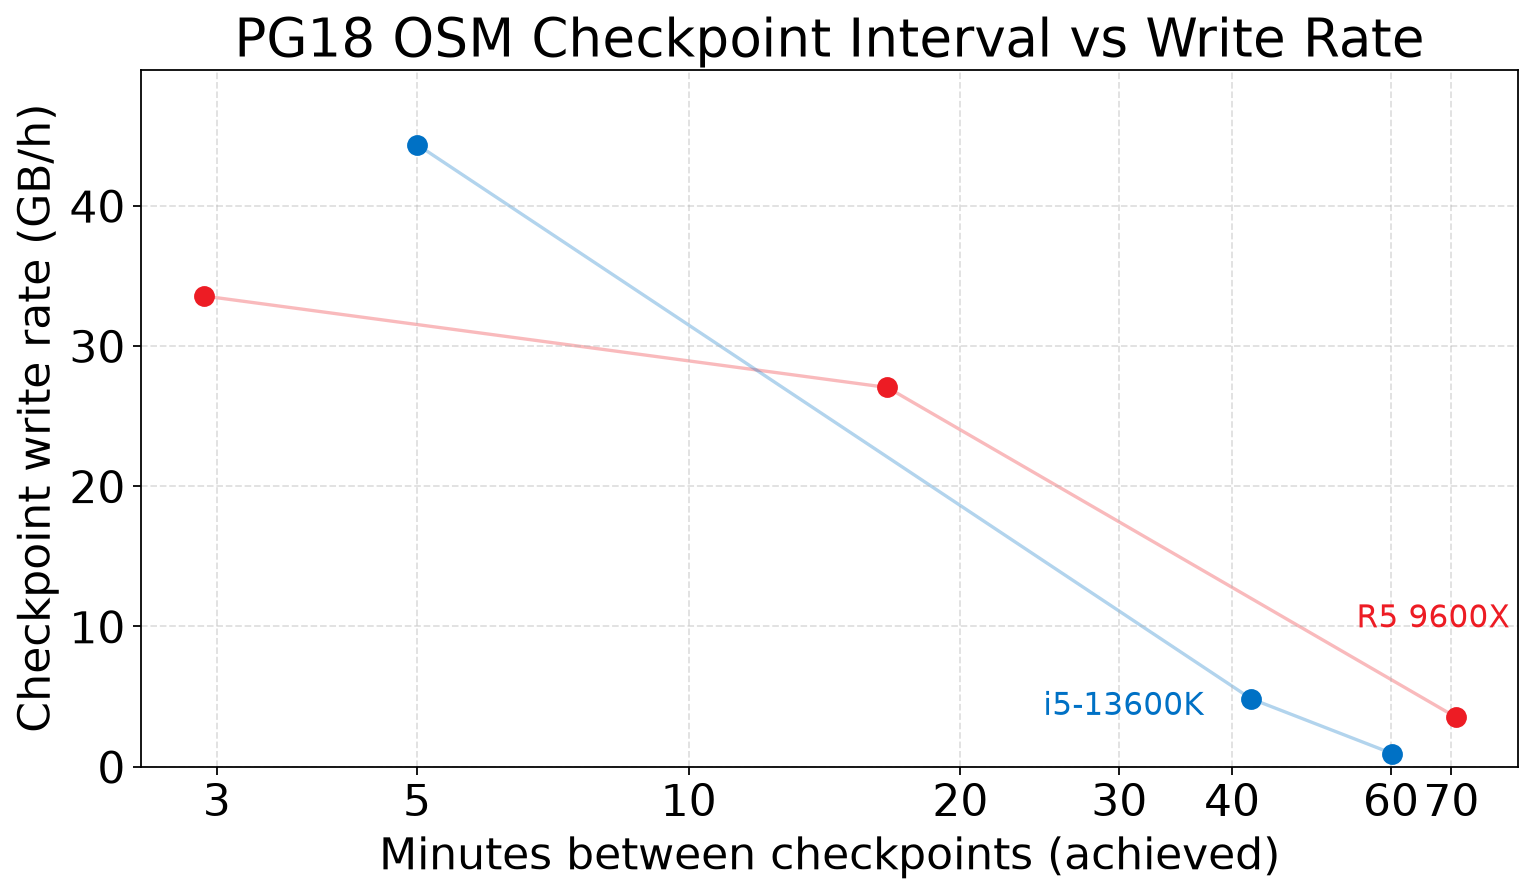
Each point is a host-local OSM load. Faint lines connect runs on the same CPU. Total throughput rises as checkpoints stretch out—compare R5 9600X at 2.9 minutes between checkpoints (669 kNodes/s) vs 70.8 minutes (733 kNodes/s)—while average checkpoint write volume collapses—a 90% IOPS reduction (34 → 3.5 GB/h on that same sweep). Durability face and max_wal_size for each point are in the table below.
Regenerate: python3 reports/osm-checkpoint.py (reads docs/results-summary/pg18/osm-checkpoint.md).
Query returned 14 rows.
| cpu | overall_kips | polygon_kips | line_kips | point_kips | node_kps | index_kips | fsync | wal_level | max_wal_gb | timeout | chkp_mins | timed_pct | chkp_mbph | clean_mbph | backend_mbph | cleaned_pct | max_dirty | hit_pct | hit_mbps | miss_mbps | wal | avg_write | max_write | avg_read | max_read |
|---|---|---|---|---|---|---|---|---|---|---|---|---|---|---|---|---|---|---|---|---|---|---|---|---|---|
| Apple M1 Pro | 161.0 | 807.0 | 1684.0 | 3315.0 | 10592.0 | 114.0 | off | minimal | 16.0 | 60 | 26.2 | 21.0 | 58.0 | 11134.0 | 193010.0 | 99.0 | 0 | 87.0 | 404.2 | 61.2 | 4.5 | 123.0 | 2576.0 | 123.0 | 2576.0 |
| Apple M4 Max | 463.0 | 2375.0 | 3751.0 | 6849.0 | 12582.0 | 273.0 | off | minimal | 256.0 | 60 | 67.2 | 100.0 | 4023.0 | 87548.0 | 127731.0 | 96.0 | 0 | 91.0 | 947.8 | 90.8 | 12.8 | 348.0 | 4763.0 | 348.0 | 4763.0 |
| Apple M4 Max Studio | 450.0 | 2496.0 | 3783.0 | 7652.0 | 12684.0 | 282.0 | off | minimal | 256.0 | 60 | 69.2 | 100.0 | 3797.0 | 85324.0 | 123978.0 | 96.0 | 0 | 91.0 | 915.9 | 88.1 | 12.4 | 196.0 | 5148.0 | 196.0 | 5148.0 |
| R5 9600X | 733.0 | 2764.0 | 5008.0 | 4040.0 | 18341.0 | 295.0 | off | minimal | 256.0 | 60 | 70.8 | 67.0 | 3622.0 | 143075.0 | 200049.0 | 98.0 | 12649791488 | 91.0 | 1506.2 | 143.2 | 20.2 | 81.0 | 5566.0 | 64.0 | 6642.0 |
| R5 9600X | 722.0 | 2381.0 | 4043.0 | 3654.0 | 19654.0 | 251.0 | on | replica | 100.0 | 60 | 16.6 | 0.0 | 27690.0 | 129752.0 | 197695.0 | 82.0 | 12650520576 | 91.0 | 1488.8 | 141.2 | 58.8 | 93.0 | 5574.0 | 64.0 | 6087.0 |
| R5 9600X | 669.0 | 2168.0 | 3544.0 | 3357.0 | 20034.0 | 222.0 | on | replica | 16.0 | 60 | 2.9 | 1.0 | 34374.0 | 117602.0 | 183484.0 | 77.0 | 18144010240 | 91.0 | 1342.1 | 130.9 | 52.2 | 88.0 | 5232.0 | 61.0 | 6130.0 |
| R9 9950X | 758.0 | 3440.0 | 7046.0 | 4741.0 | 20885.0 | 366.0 | off | minimal | 256.0 | 60 | 68.4 | 67.0 | 3477.0 | 272977.0 | 374661.0 | 99.0 | 12359143424 | 96.0 | 3867.7 | 148.3 | 21.2 | 83.0 | 7282.0 | 66.0 | 5763.0 |
| i3-13100 | 524.0 | 1692.0 | 2875.0 | 2540.0 | 12754.0 | 176.0 | on | replica | 256.0 | 60 | 42.5 | 43.0 | 12038.0 | 100984.0 | 143370.0 | 89.0 | 13151457280 | 91.0 | 1077.4 | 102.4 | 42.3 | 67.0 | 4387.0 | 47.0 | 4382.0 |
| i3-13100 | 513.0 | 1589.0 | 2630.0 | 2445.0 | 12398.0 | 167.0 | on | minimal | 100.0 | 60 | 37.9 | 50.0 | 6371.0 | 97148.0 | 140029.0 | 94.0 | 12793417728 | 91.0 | 1064.7 | 100.1 | 14.9 | 58.0 | 3473.0 | 45.0 | 4499.0 |
| i3-13100 | 521.0 | 1939.0 | 3519.0 | 2783.0 | 12498.0 | 204.0 | off | minimal | 16.0 | 60 | 9.3 | 6.0 | 7587.0 | 97503.0 | 142238.0 | 93.0 | 12736143360 | 91.0 | 1077.4 | 101.8 | 14.4 | 56.0 | 3834.0 | 45.0 | 3914.0 |
| i5-13600K | 646.0 | 2410.0 | 5248.0 | 3778.0 | 11984.0 | 274.0 | off | minimal | 256.0 | 60 | 60.2 | 75.0 | 961.0 | 126700.0 | 175937.0 | 99.0 | 18488303616 | 91.0 | 1260.9 | 126.1 | 17.8 | 52.0 | 8230.0 | 41.0 | 5848.0 |
| i5-13600K | 618.0 | 2298.0 | 4294.0 | 3565.0 | 14610.0 | 251.0 | off | minimal | 100.0 | 60 | 42.0 | 33.0 | 4959.0 | 117137.0 | 169389.0 | 96.0 | 14454235136 | 91.0 | 1274.7 | 120.9 | 17.1 | 67.0 | 3955.0 | 55.0 | 5406.0 |
| i5-13600K | 603.0 | 1878.0 | 3183.0 | 2981.0 | 15180.0 | 198.0 | on | replica | 100.0 | 5 | 5.0 | 88.0 | 45431.0 | 94277.0 | 165636.0 | 67.0 | 11625320448 | 91.0 | 1254.1 | 118.0 | 49.2 | 79.0 | 3908.0 | 54.0 | 5306.0 |
| NVIDIA P4242 | 425.0 | 2246.0 | 4741.0 | 3546.0 | 15612.0 | 252.0 | off | minimal | 256.0 | 60 | 61.0 | 100.0 | 4532.0 | 83199.0 | 279614.0 | 95.0 | 13693992960 | 92.0 | 919.4 | 82.6 | 11.7 | 137.0 | 6597.0 | 112.0 | 6625.0 |