OSM Power
OSM load throughput vs package power draw.
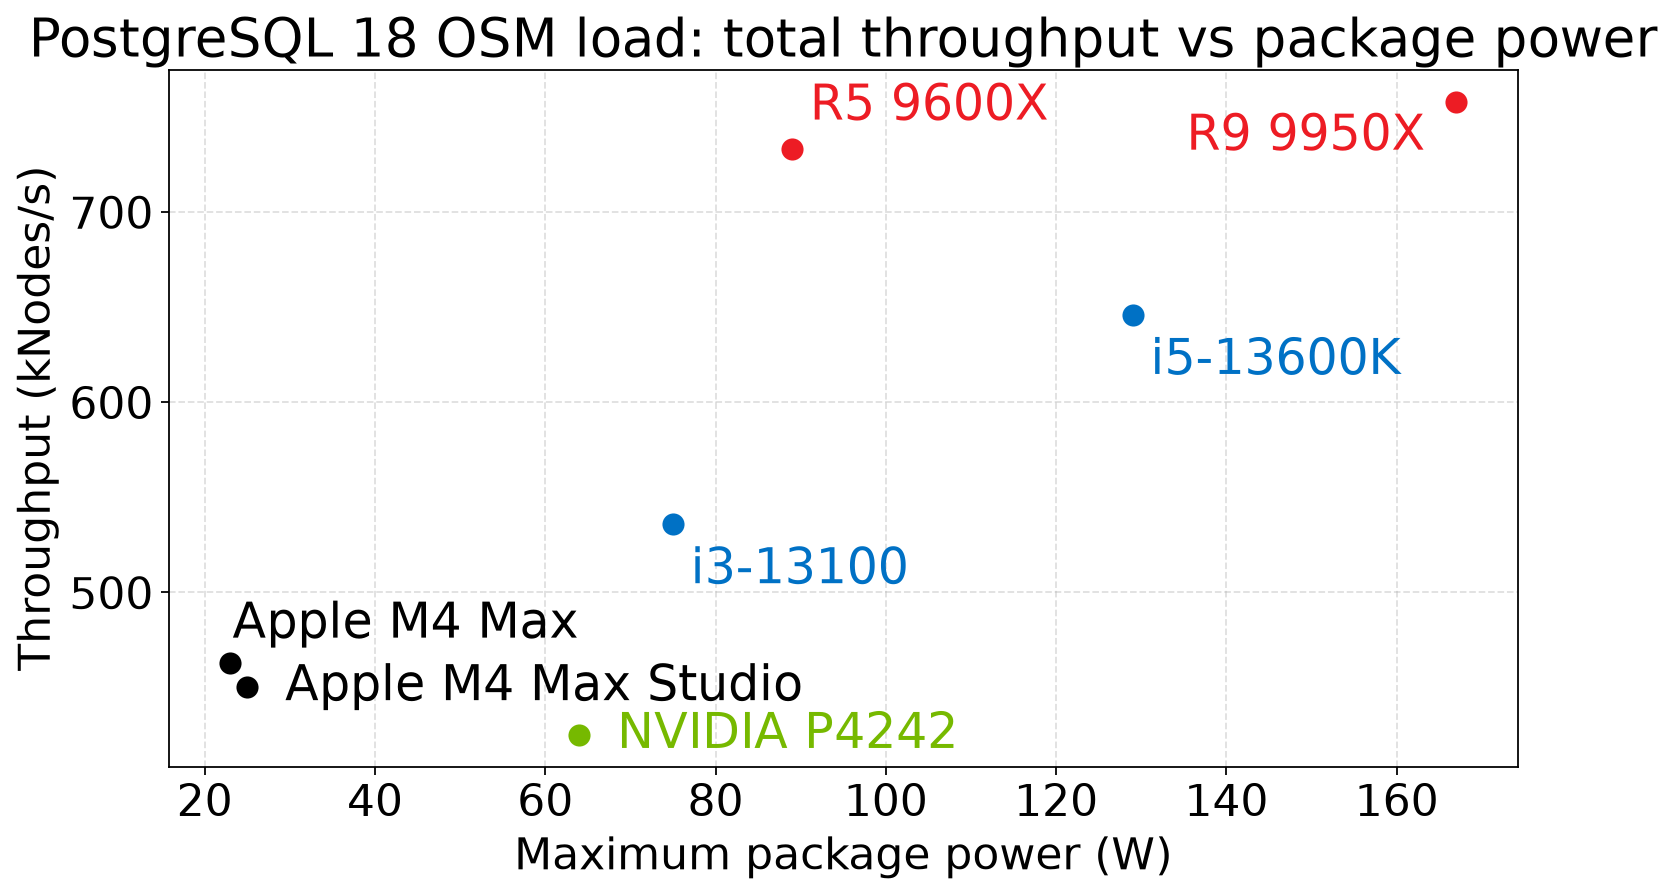
Each CPU is positioned by maximum package watts during the load. Desktop AMD (R9 9950X, R5 9600X) leads on raw kNodes/s; NVIDIA Spark (P4242) sits mid-chart at 425 kNodes/s and 64 W peak; Apple M4 Max reaches 463 kNodes/s at only 23 W. R9 9950X peaks at 758 kNodes/s total at 167 W; Apple M4 Max Studio reaches 450 kNodes/s at 25 W.
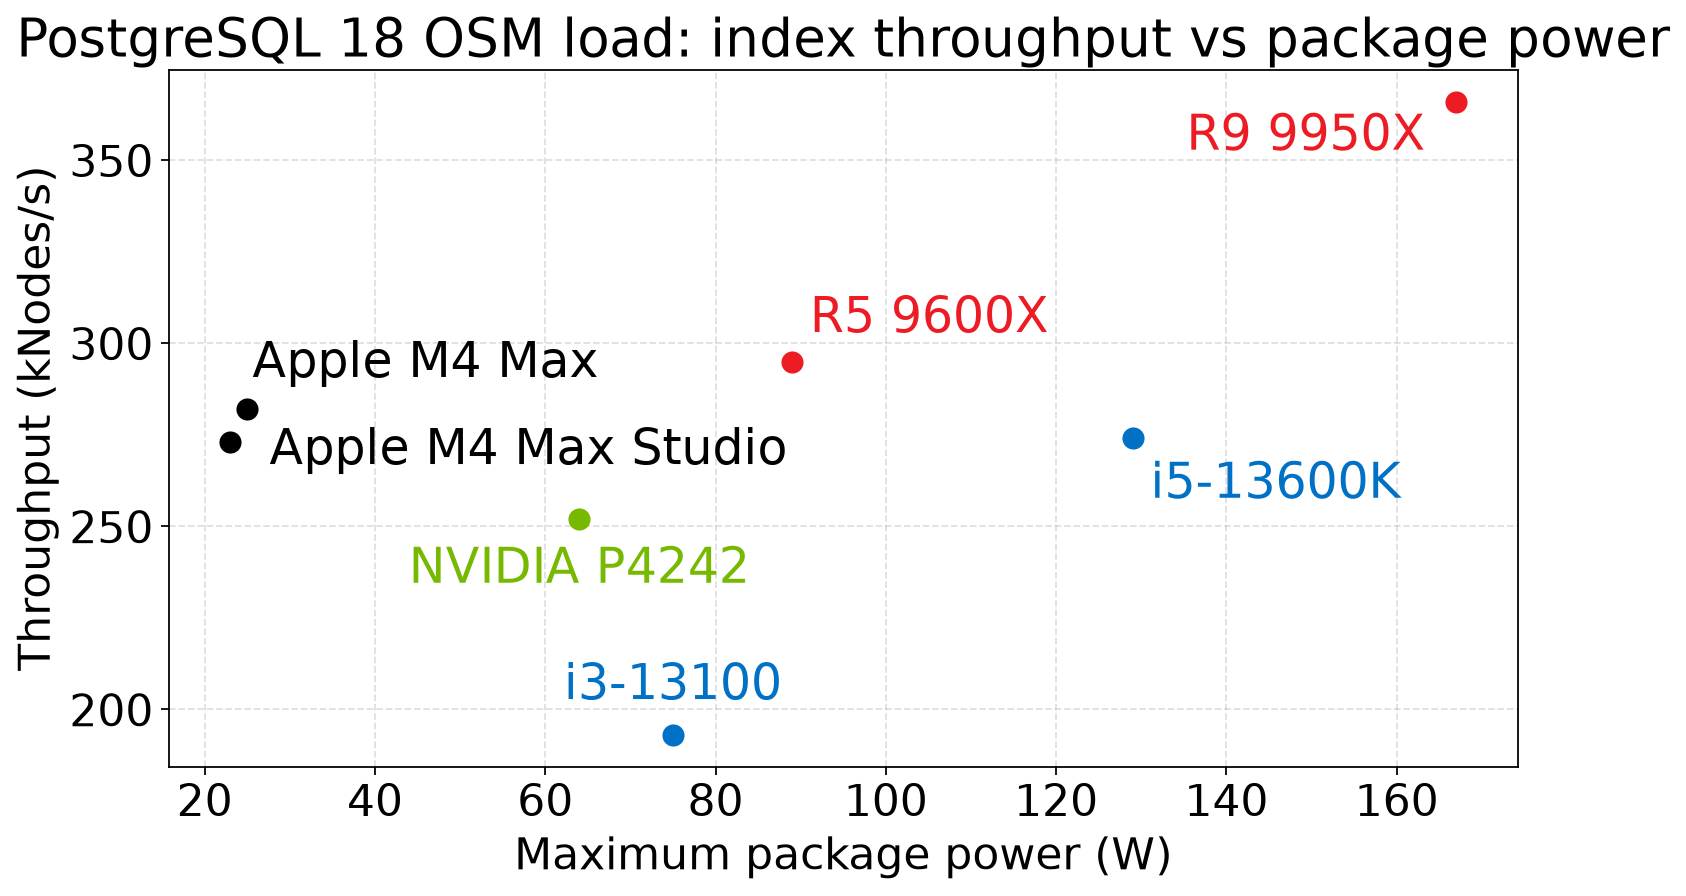
Index build throughput only—Apple M4 Max Studio leads efficiency per watt here, reaching 282 kNodes/s at 25 W peak; desktop AMD still leads on raw index kNodes/s.
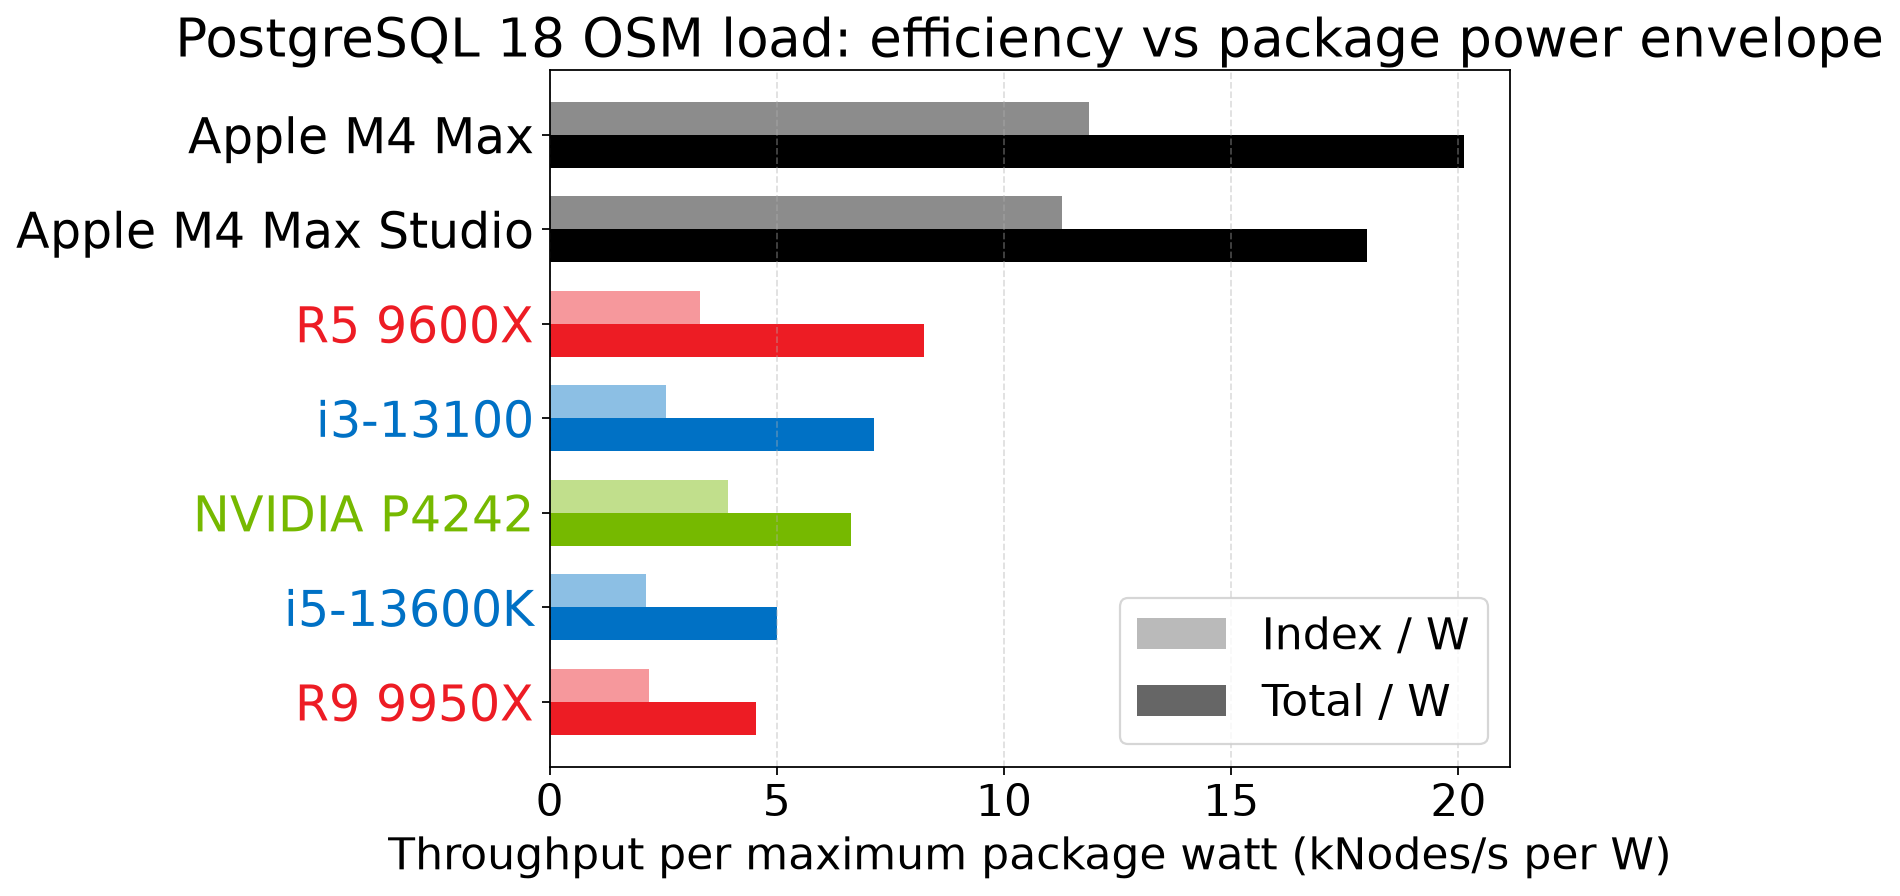
Throughput per peak watt favors efficiency cores—Apple M4 Max leads on both total and index load. NVIDIA Spark lands between R5 9600X and the high-TDP Intel/AMD parts on kNodes/s per watt; desktop chips that move more data overall often draw far more power for it. Rows marked est in the table lacked average-power samples; charts use max_pkg because every CPU has it.
Regenerate throughput charts: python3 reports/osm-power.py (reads the first table below).
Snapshot of the Streamlit explorer — down between releases (OSM Power) on 2026-08-09. Captured by explorer/snapshot-streamlit.py from the live site.
Query returned 7 rows.
| cpu | mem_gb | nodes_kips | index_kips | pwr_est | max_pkg | avg_pkg | fsync | wal | avg_write | max_write | avg_read | max_read | cpu_c |
|---|---|---|---|---|---|---|---|---|---|---|---|---|---|
| R9 9950X | 124 | 758.0 | 366.0 | 167.0 | 75.0 | off | 21.2 | 83.0 | 7282.0 | 66.0 | 5763.0 | #ED1C24 | |
| R5 9600X | 124 | 733.0 | 295.0 | 89.0 | 47.0 | off | 20.2 | 81.0 | 5566.0 | 64.0 | 6642.0 | #ED1C24 | |
| i5-13600K | 188 | 646.0 | 274.0 | 129.0 | 47.0 | off | 17.8 | 52.0 | 8230.0 | 41.0 | 5848.0 | #0071C5 | |
| i3-13100 | 125 | 536.0 | 193.0 | est | 75.0 | on | 43.0 | 67.0 | 4141.0 | 47.0 | 4329.0 | #0071C5 | |
| Apple M4 Max | 128 | 463.0 | 273.0 | 23.0 | 8.0 | off | 12.8 | 348.0 | 4763.0 | 348.0 | 4763.0 | #000000 | |
| Apple M4 Max Studio | 128 | 450.0 | 282.0 | 25.0 | 5.0 | off | 12.4 | 196.0 | 5148.0 | 196.0 | 5148.0 | #000000 | |
| NVIDIA P4242 | 119 | 425.0 | 252.0 | 64.0 | 25.0 | off | 11.7 | 137.0 | 6597.0 | 112.0 | 6625.0 | #76B900 |
Relation power efficiency
Relation-build throughput during OSM planet load, normalized by average package watts over the full run (not peak).
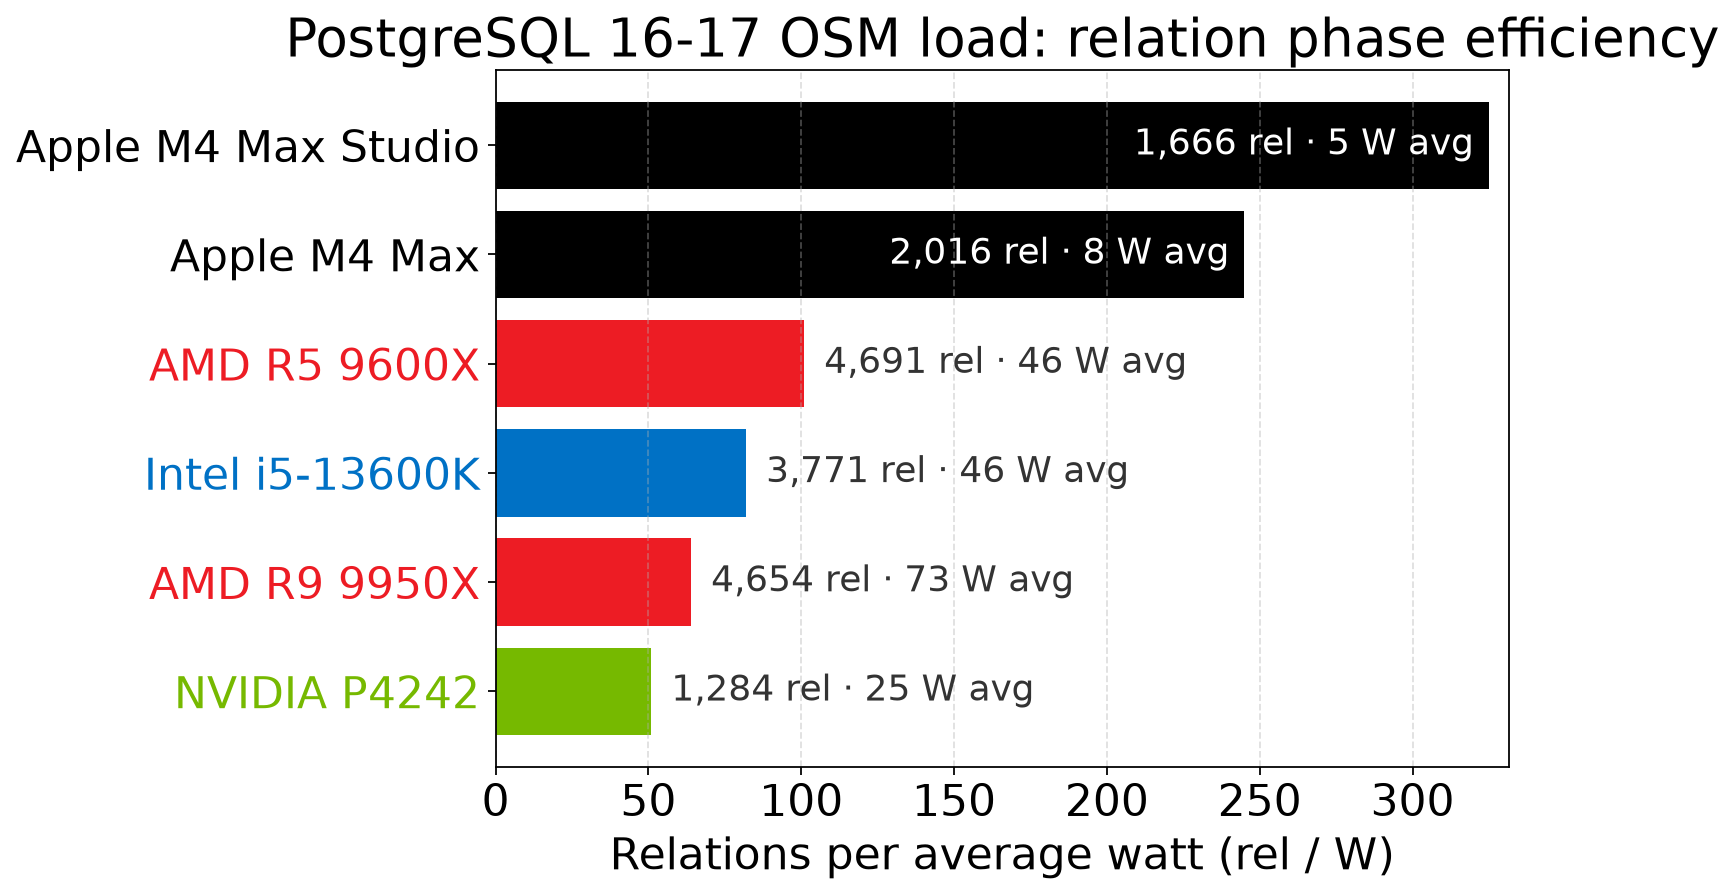
Apple M4 Max Studio leads at 325 relations per watt (1666 rel at 5 W average); desktop AMD and Intel parts move more relations overall but at higher average draw. Bar labels show raw relation count and average watts.
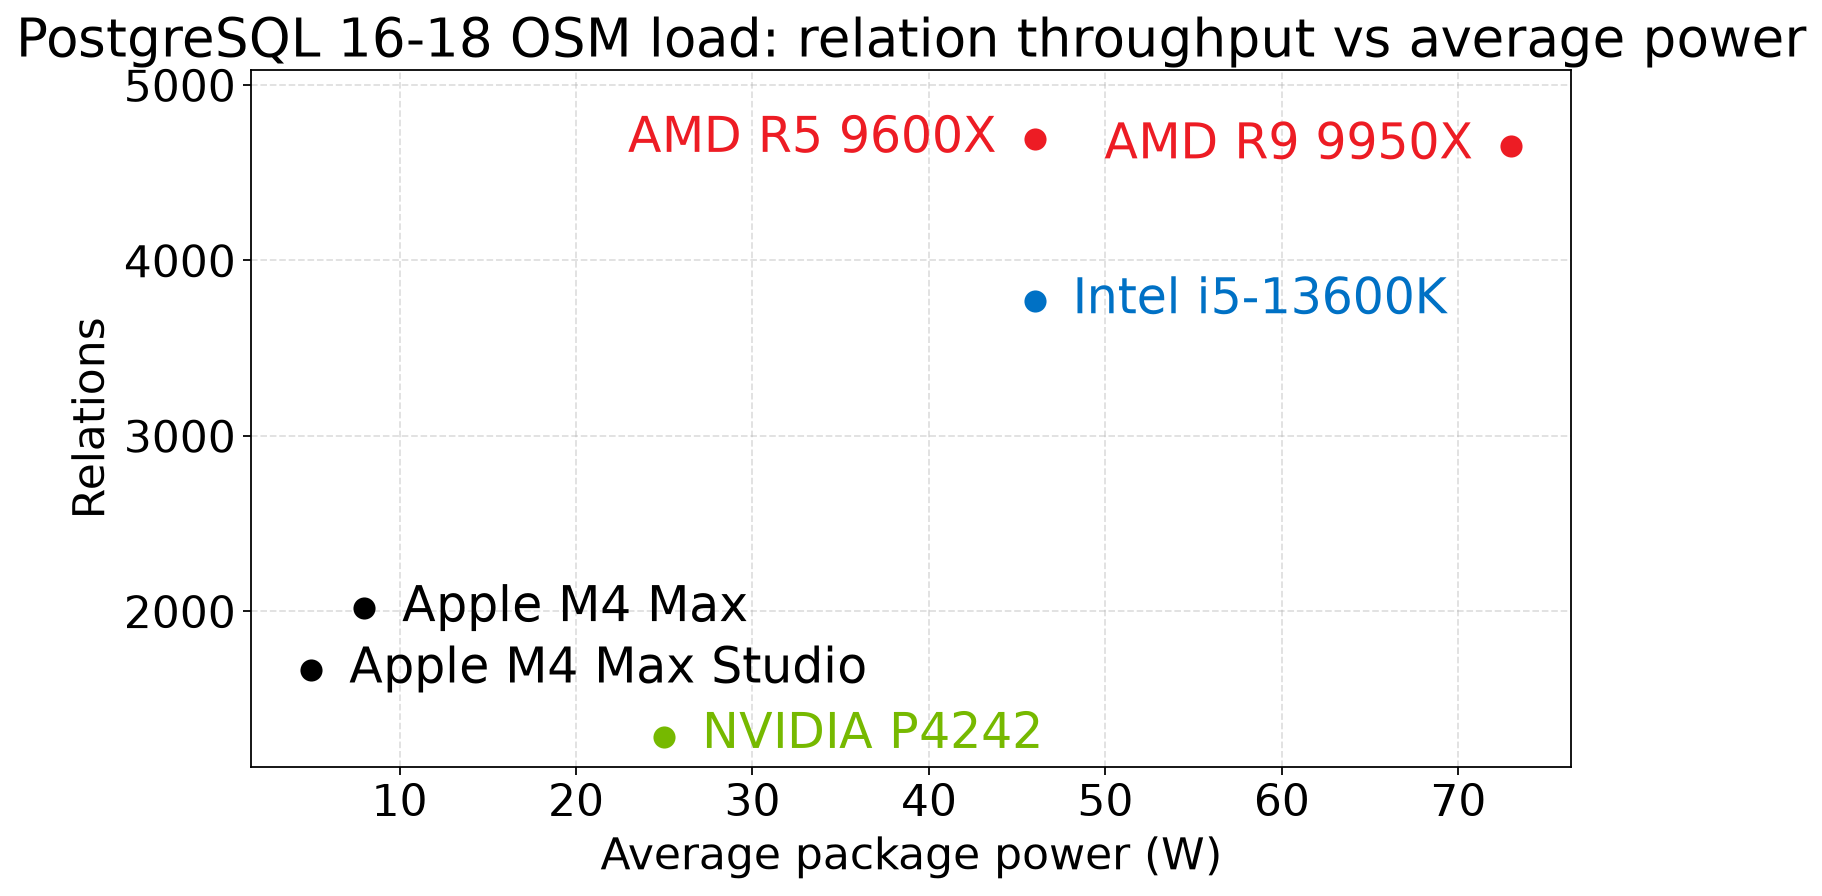
The scatter view shows the same data directly: R5 9600X and R9 9950X reach the highest relation counts at 46–73 W average, while Apple Silicon stays in the lower-left with strong rel_per_watt efficiency.
Regenerate: python3 reports/osm-relation-power.py (reads the relation table below).
| cpu | ver | rel | avg_watts | max_watts | rel_per_watt | cpu_c |
|---|---|---|---|---|---|---|
| Apple M4 Max | 17 | 2016 | 8 | 23 | 245 | #000000 |
| Apple M4 Max Studio | 17 | 1666 | 5 | 25 | 325 | #000000 |
| NVIDIA P4242 | 16 | 1284 | 25 | 64 | 51 | #76B900 |
| AMD R5 9600X | 17 | 4691 | 46 | 89 | 101 | #ED1C24 |
| AMD R9 9950X | 17 | 4654 | 73 | 168 | 64 | #ED1C24 |
| Intel i5-13600K | 17 | 3771 | 46 | 124 | 82 | #0071C5 |