ARM vs x86: slow scattered index→heap buffer misses
Status: Initial report (2026-11-13); culprits 2026-11-15; Darwin I/O-class closed and Abbey disk-fill eject 2026-11-21. Intended for discussion on pgsql-hackers.
Not a PG19 regression, and not an AIO bug. This Relations lag has shown up consistently on Darwin (Abbey) since PG17, and on court (NVIDIA DGX Spark) back through PG16. It looks “new” only because nobody had isolated a small public case before. The causes are in the desktop ARM platforms’ I/O path, not in Postgres. On court the main culprit is NVMe interrupt coalescing left on by the drive firmware. On Darwin it is Homebrew’s brew services LaunchAgent, which clamps Postgres to a utility I/O class. See Culprits identified so far. It also barely shows up in the wild: the OSM planet load that surfaces it needs a fast database and a client with enough RAM to hold a large nodes cache (~128 GB class). Most setups never get into that corner.
On a pair of ~128 GB bare metal NVMe boxes, the OSM Relations phase is about 3.5× slower on ARM than on a similar-class x86 host. The numbers below happen to be from a 19 durable face; older majors show the same shape.
| host | CPU | Relations build time (s) | Overall OSM build (s) |
|---|---|---|---|
| court (ARM) | NVIDIA P4242 / Cortex-X925+A725, 20 threads, ~121 GB, Samsung 3.7 TB NVMe | 13251 | 30871 |
| twilight (x86) | i5-13600K, 20 threads, ~125 GB, Kingston 3.7 TB NVMe | 3797 | 19118 |
Same durability class (wal_level=replica, fsync=on), same planet load path. Court tests 149; twilight 2713.
On x86 this workload is write I/O bound. Profiles on ARM light up the single-block buffer-fill path:
StartReadBuffer→pgaio_io_perform_synchronously→pread
That name looks like AIO. It is not the story. For index nested-loop heap fetches the fill is intentionally synchronous even under io_method=worker — shared plumbing, not a worker handoff. The profile is where the miss waits. Isolation below (io_method=sync ≈ worker) confirms the gap does not move with the AIO method.
The usual CPU suspects do not add up here. Missing wide AVX-class SIMD on ARM, or a big Intel core’s stronger branch prediction, would show up as busy Postgres backends burning cycles. On these tests the ARM CPUs were mostly idle — stuck waiting somewhere. This is stalling, not “x86 executes the same Postgres path faster.” That also explains the very low package power in these sections. The power cliff during this phase was the first clue that the cores were not working hard. On court, what they were waiting for turned out to be deferred NVMe completion interrupts.
pgbench reproduction workload
The OSM path is a poor first repro: too much hardware and too long a run. A small durable-face miniature with the same access shape is below.
pgbench custom script select-scatter-64: 64 unsorted random aids → nested-loop index probes + heap fetches on pgbench_accounts. Size is in the script name; wl/arm-miss-isolation sets MULTI=64 so tests.multi matches (unlike select-pages, which varies MULTI on one script). Planner forced to that access pattern:
ALTER DATABASE pgbench SET enable_seqscan = off;
ALTER DATABASE pgbench SET enable_bitmapscan = off;
ALTER DATABASE pgbench SET enable_hashjoin = off;
ALTER DATABASE pgbench SET enable_mergejoin = off;
Trimmed script, the full file has \set a01 … \set a64; each txn draws 64 independent aids:
\set limit 100000 * :scale
\set a01 random(1, :limit)
\set a02 random(1, :limit)
-- … a03 … a63 …
\set a64 random(1, :limit)

SELECT sum(a.abalance)
FROM unnest(ARRAY[
  :a01,:a02, /* … :a03 … :a63 … */ :a64
]::bigint[]) AS u(aid)
JOIN pgbench_accounts a ON a.aid = u.aid;
Database is sized to be about 2× RAM to trigger real cache misses. The Linux pair is scale 13700 (~200 GB); Abbey (Darwin) is scale 17500 (~256 GB, ~2×RAM).
Two passes after a cold OS cache drop: cold = first pass, hot = second. Gaps are stable either way.
Artifacts in this study directory, also wired into the live toolkit as tests/select-scatter-64.sql and wl/arm-miss-isolation:
| File | Role |
|---|---|
| select-scatter-64.sql | pgbench script |
| arm-miss-isolation | run grid / cold start / RA cells |
| iso-io-worker.conf / iso-io-sync.off | flip io_method for the sync cell |
Reproduce via pgbent
The script gives additional setup detail, the basics are:
./newset 'ARM miss isolation — select-scatter-64 durable baseline'
SKIPINIT=0 COLD=0 SCALES=17500 ./wl/arm-miss-isolation   # build DB
SKIPINIT=1 COLD=1 CELL=baseline SCALES=17500 ./wl/arm-miss-isolation
# then CELL=sync (after flipping io_method), CELL=ra128 / ra0 on Linux
Results: Linux isolation: PG 19rc2, scale 13700 = 200GB database
Clients = 1
| cell | ARM court cold | ARM court hot | x86 twilight cold | x86 twilight hot |
|---|---|---|---|---|
| worker, RA=2048 | 35 | 73 | 158 | 306 |
| sync, RA=2048 | 34 | 72 | 158 | 306 |
| worker, RA=128 | 33 | 70 | — | — |
| worker, RA=0 | 17 | 36 | — | — |
| worker, eic=0 | 35 | 72 | 158 | 306 |
Clients = 32
| cell | ARM court cold | ARM court hot | x86 twilight cold | x86 twilight hot |
|---|---|---|---|---|
| worker, RA=2048 | 1865 | 1871 | 6655 | 6699 |
| sync, RA=2048 | 1936 | 1879 | 6540 | 6678 |
| worker, RA=128 | 1848 | 1851 | — | — |
| worker, RA=0 | 913 | 1018 | — | — |
| worker, eic=0 | 1868 | 1883 | 6522 | 6678 |
Sets: court 14–18; twilight 124–126. Court’s grid ran with the drive’s shipped interrupt coalescing (see below).
- Cold OS page cache before the grid (Linux
drop_caches; Darwinpurge) - Clients 1 / 8 / 32, 180 s, two passes
shared_buffers48 GB; default cellio_method=worker; Linux deviceread_ahead_kb=2048unless noted
Darwin ARM cross-check (PG 18.6, scale 17500)
Abbey — Apple M4 Max, 128 GB, macOS. High durability (fsync=on, wal_level=replica, io_method=worker). Slightly larger DB than the Linux pair, mild handicap versus Linux tests. Set 13 ran under Homebrew brew services (utility I/O clamp). Set 20 is the published unclamped peer (pg_ctl / tier 0).
| clients | set 13 cold (clamped) | set 13 hot | set 20 cold (tier 0) | set 20 hot |
|---|---|---|---|---|
| 1 | 85 | 115 | 86 | 139 |
| 8 | 867 | 957 | 1040 | 1209 |
| 32 | 2331 | 2400 | 3188 | 3368 |
Takeaways
io_method=sync≈workeron both Linux hosts. The ARM/x86 gap does not move. AIO method is not the cause (and this was never a PG19-only symptom — see opening). Select-scatter cells here are 19rc2 on Linux and 18.6 on Darwin only because that is what was handy to instrument.- Court
read_ahead_kb2048 vs 128 is flat. Setting 0 hurts (~½ throughput). The gap is not ARM reading ahead too much at 2048. effective_io_concurrency=0is flat on both hosts (court 18, twilight 126 vs their worker baselines). Prefetch/EIC is not the lever for this NL heap-fetch shape either.- A second ARM vendor/OS is also well below x86. At 32 clients hot, x86 twilight (~6700) is ~3.5× court as shipped, ~1.7× court with coalescing off (~3880), and ~2.0× M4 Abbey unclamped (set 20, ~3370). Both ARM hosts lose to the x86 box, though as the next section shows, not for the same reason.
After (1)–(4), what remains is miss cost on the desktop ARM platforms themselves for this scattered index→heap pattern. It’s not CPU efficiency, not read_ahead_kb, not effective_io_concurrency, and not a new release or AIO landing.
Culprits identified so far
Slow small random reads on desktop ARM appear to be a known platform problem, one that server ARM like Graviton is not reported to share. It just hadn’t been isolated on a Postgres workload before. Each ARM host here has its own cause.
DGX Spark (court): NVMe interrupt coalescing — confirmed
Court’s drive (Samsung MZALC4T0HBL1, OEM firmware NXHB202Q) ships with NVMe interrupt coalescing enabled on every I/O queue: 100 µs aggregation time, threshold 8 completions. The drive raises a completion interrupt only after 8 completions pile up on a queue or 100 µs pass. A backend waiting on one synchronous pread never reaches 8, so every read waits out the timer. Twilight’s Kingston has coalescing off. Nothing in court’s OS configuration sets it; it is the firmware default.
blktrace/btt on a cold c=1 select-scatter-64 pass shows the whole gap is in D2C, the time from dispatch to the drive until the completion is handled. Kernel queueing and the I/O scheduler (none on both hosts) are under 1% of each read:
| cold c=1, 60 s | court as shipped | court coalescing off | twilight |
|---|---|---|---|
select-scatter-64 TPS | 32 | 92 | 141 |
| reads completed | 238k | 644k | 969k |
| avg D2C per read | 210 µs | 69 µs | 47 µs |
| kernel queue + scheduler share | 0.7% | 0.6% | 0.2% |
The timer’s minimum nonzero value is 100 µs, so lowering the threshold can’t help a lone synchronous reader; off is the only useful setting. At high queue depth the drive is fine — coalescing is a throughput / interrupt-rate trade that makes sense as a desktop OEM default, and is the wrong trade for Postgres buffer misses. That is court’s #1 problem for this workload. Full x86 parity is not expected after the fix. The remaining gap vs farm x86 looks roughly proportional to clock — Grace here ~2.8 GHz vs desktop x86 in ~5.7 GHz territory (~2×); see DGX Spark § Residual vs x86.
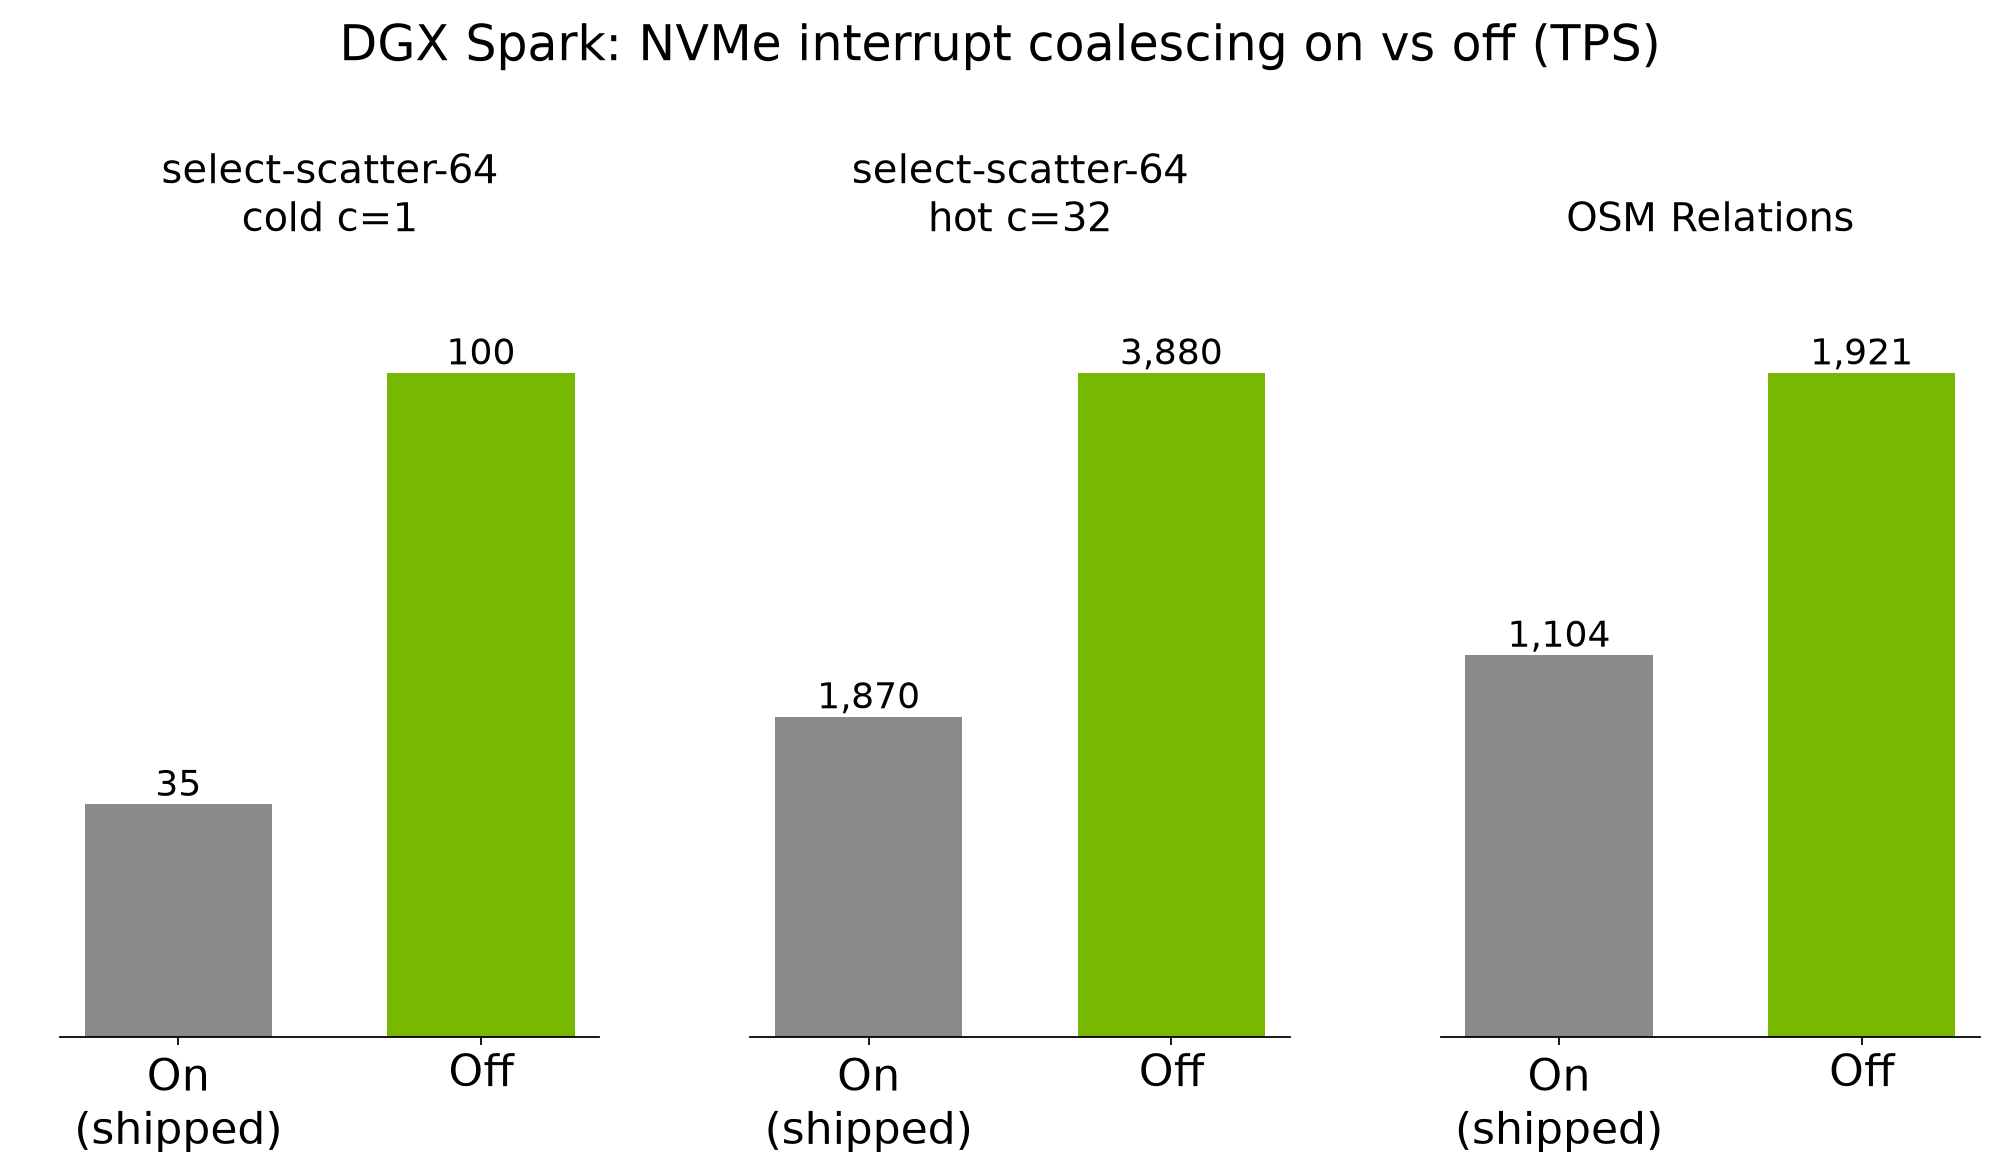
Operator recipe and numbers: NVMe interrupt coalescing.
Repeating the full isolation grid with coalescing off (sets 19–23, same 180 s cold/hot protocol as the shipped grid above):
| cell | court cold c=1 | court hot c=1 | court cold c=32 | court hot c=32 |
|---|---|---|---|---|
| worker, RA=2048 | 100 | 178 | 3891 | 3883 |
| sync, RA=2048 | 96 | 176 | 3890 | 3889 |
| worker, RA=128 | 97 | 176 | 3953 | 3943 |
| worker, RA=0 | 60 | 116 | 3069 | 3067 |
| worker, eic=0 | 95 | 180 | 3900 | 3895 |
Same shape as before (AIO / RA128 / eic flat; RA=0 still hurts), but ~3× the old cold c=1 and ~2× the old c=32. Versus twilight’s 158/306 at c=1 and 6655/6699 at c=32, court is about 1.6× behind at c=1 cold and 1.7× at c=32 hot. Not parity, and not claimed to be.
Things checked and ruled out on court along the way:
- IRQ placement / CPU pinning.
irqbalanceisn’t running; the kernel’s managed blk-mq mapping gives each big X925 core its own queue, and pairs of little A725 cores share one. Pinning a process to a big core gained about 5% in either coalescing state; pinning to a little core lost about 20%.rq_affinity=2was neutral to slightly worse. - Power management. PCIe ASPM is disabled on the link (Gen5 x4, no downtraining). NVMe APST steps down only after 100 ms idle, which never happens under steady load.
- I/O scheduler.
none; under 1% of each read’s time.
pgbent now disables NVMe coalescing in util/pgbent_tune, which newgis runs after every boot alongside readahead and the CPU governor. The setting is not saved to the drive, so a power cycle restores the firmware default — same convention as the other post-boot knobs.
Darwin (Abbey): Homebrew LaunchAgent I/O class — confirmed / closed
Homebrew’s brew services installs a LaunchAgent (sh.brew.postgresql@N) that starts Postgres under launchd. On Apple Silicon that agent runs with a QoS clamp of THREAD_QOS_UTILITY, which also drops the process to I/O throttle tier 1 (STANDARD) instead of tier 0 (IMPORTANT). Disk reads from that postmaster are treated as background relative to interactive work. taskinfo on the postmaster shows the clamp; backends inherit it.
Published grids (same 8 KB Homebrew binary, scale 17500, durable face): set 13 clamped vs set 20 pg_ctl tier 0 — see the Darwin cross-check table above. Unclamping is about +20% at c=1 hot and +40% at c=32. An earlier ad-hoc restart A/B saw the same direction. Intermittent “Darwin looks fine / then doesn’t” OSM behavior matches sometimes using brew services and sometimes a manual pg_ctl.
Recipe: for database work on macOS, do not use brew services as the long-running server. Stop the LaunchAgent and start with pg_ctl (set LC_ALL to a real locale — Homebrew’s plist does that; a bare pg_ctl without it can fail with “postmaster became multithreaded during startup”). A custom LaunchDaemon/LaunchAgent without the utility clamp would also work; the stock Homebrew one does not. Operator detail: macOS LaunchAgent I/O class.
Block size is not the lever here. A from-source PG 18.6 build with --with-blocksize=16 (matching Apple Silicon’s 16 KB VM pages) was A/B’d unclamped against the 8 KB Homebrew cluster on the same cold select-scatter-64 protocol: ~71 vs ~68 TPS at c=1, ~2198 vs ~2160 at c=32 — flat. Prefer fixing the I/O class over a custom page size.
OSM: unclamped durable set 15 moved Relations ~1.43× (~10600 s → 7527 s, ~1944/s). Cool-disk retry set 16 matched (~1930/s Relations, 10.41h, index 67 kNodes/s, score 279) — board cell. Clean-disk confirmation set 21 (~1.4 Ti free) kept the same ~40k s index wall and finished 10.86h / score 276. Unclamping helps Relations and scatter; it is not a free win for planet indexes or overall score. btree init tier ladder (sets 17/18) was mostly flat. Investigation closed.
Disk fill is a separate invalidation. Set 11 tests 67/68 (~11.1 h, scores 268/270) were low-free-space SSD collapses and have been ejected from the Abbey results DB. Runs over ~11 h on this box are not fair cells. The durable-unclamp index cost (~40k s) is not that cliff.
Handoff
The useful product is a public reproduction of a long-standing platform gap that OSM only shows on high-end hardware. Postgres isn’t the place to fix it. On court, the main cause was a drive firmware default that any Postgres user on that hardware can switch off at boot; that default is a reasonable OEM choice for interrupt rate, just a bad match for this access pattern. On Darwin, the main cause was running the server as a Homebrew LaunchAgent with a utility I/O class. Distilled operator guidance from this study lives under Platform guides.
Natural next reproduction: Graviton or another server-class Linux ARM vendor. Hoping someone on -hackers will try the same select-scatter-64 cold grid there, and check nvme get-feature -f 8 while at it. The expected result is that Graviton keeps up with x86 hosts like twilight, which would confirm this is a desktop ARM platform issue rather than anything about ARM in general.
Open loose ends
- Court OSM coalescing off: durable set 24 / test 217 Relations ~1.74× (13251 s → 7614 s), 6.48h, score 656; fast set 25 / test 218 6.12h, score 780 — on the public boards.
- Court’s remaining ~2× Relations gap vs a good x86 after coalescing — suspected mostly the ~2.8 vs ~5.7 GHz clock envelope; not assumed to reach parity.
- Abbey Darwin I/O-class closed (2026-11-21): scatter set 20 vs 13; OSM board set 16 (score 279); set 21 confirmation banked; disk-fill tests 67/68 ejected. Not chasing further.
- Twilight
read_ahead_kbladder + OSM RA=0 (sets 134–146) and wrap fast OSM set 152 (570 / 5.26h, not board-best) banked; RA=0 cost under Linux standard OS tuning § Read-ahead. - CPU and power cost of coalescing off (court avg package ~24→34 W; Relations/watt still up).
Next probes (court predictable; same MULTI / one-knob style)
Court is stable enough to use the results DB the way GUC studies already do: hold the face fixed, change one benchmark parameter, label it in tests.multi (or SETCLIENTS), compare.
-
OSM client / process parallelism on ARM. Twilight and siren settled on
SETCLIENTS=5/ osm2pgsql--number-processes 5long ago. Court (20 mixed cores, coalescing off) may want a different optimum — ladder a few process counts on the same durable (or fast) face and pick by Relations/s and overall wall clock, not by habit. -
select-scatter-Nsize ladder — court set 30 done (scripts 1 / 2 / 4 / 8 / 16 / 64, cold/hot, coalescing off). Still to run: same ladder on twilight (x86 peer); Abbey later if useful. Scripts live astests/select-scatter-N.sqlwithSCATTER=N/MULTI=Nviawl/arm-miss-isolation.