pgbench SELECT
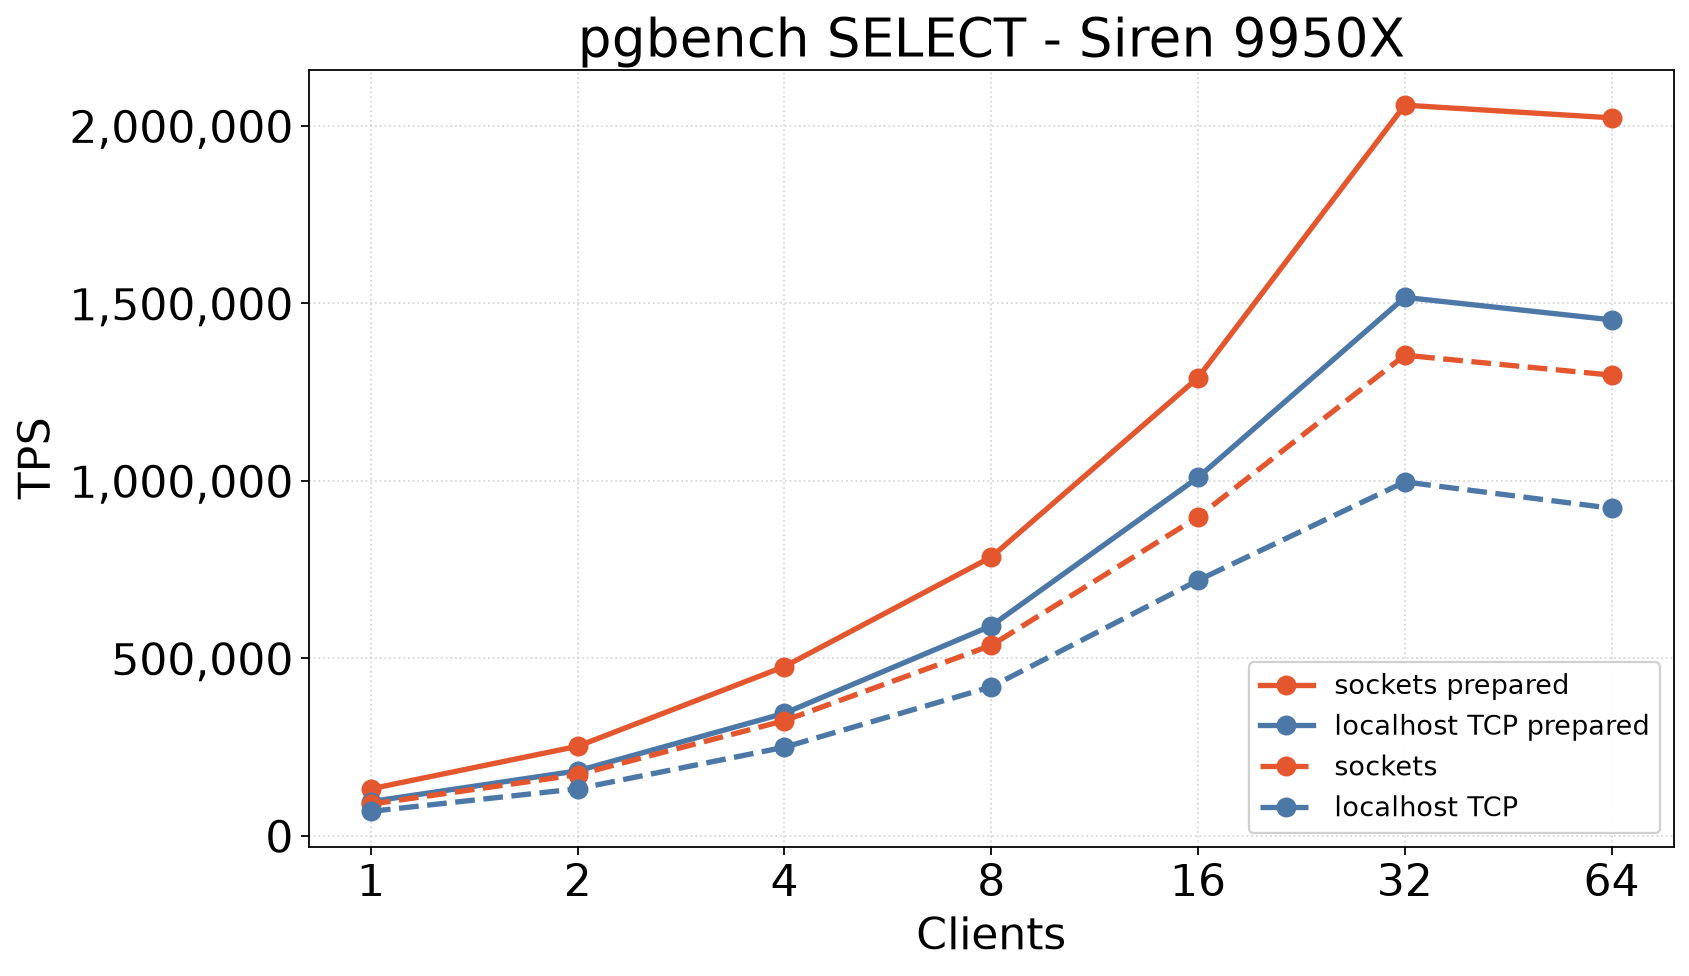
Four-face connection sweep on siren (R9 9950X), PostgreSQL 19rc1, scale 100, 90s. Unix sockets vs localhost TCP, simple vs -M prepared. Public ranking graph: Leaderboards. This page is the 19rc1 snapshot of that board plus the 18↔19 check.
Peak is 32 clients, sockets prepared 2.06M TPS. Localhost TCP prepared is 1.52M (~26% below sockets). Package watts: 1-client ~62 W; from 16 clients up the 9950X sits on the ~200 W PPT rail (RAPL avg 199.6).
Transactions per joule uses the same 1-second PkgWatt integral as OSM kJ. At 32 clients every face burns ~17.8 kJ in 90s. Sockets prepared does 10,406 txn/J; localhost TCP simple does 5,040. Same joules, twice the work.
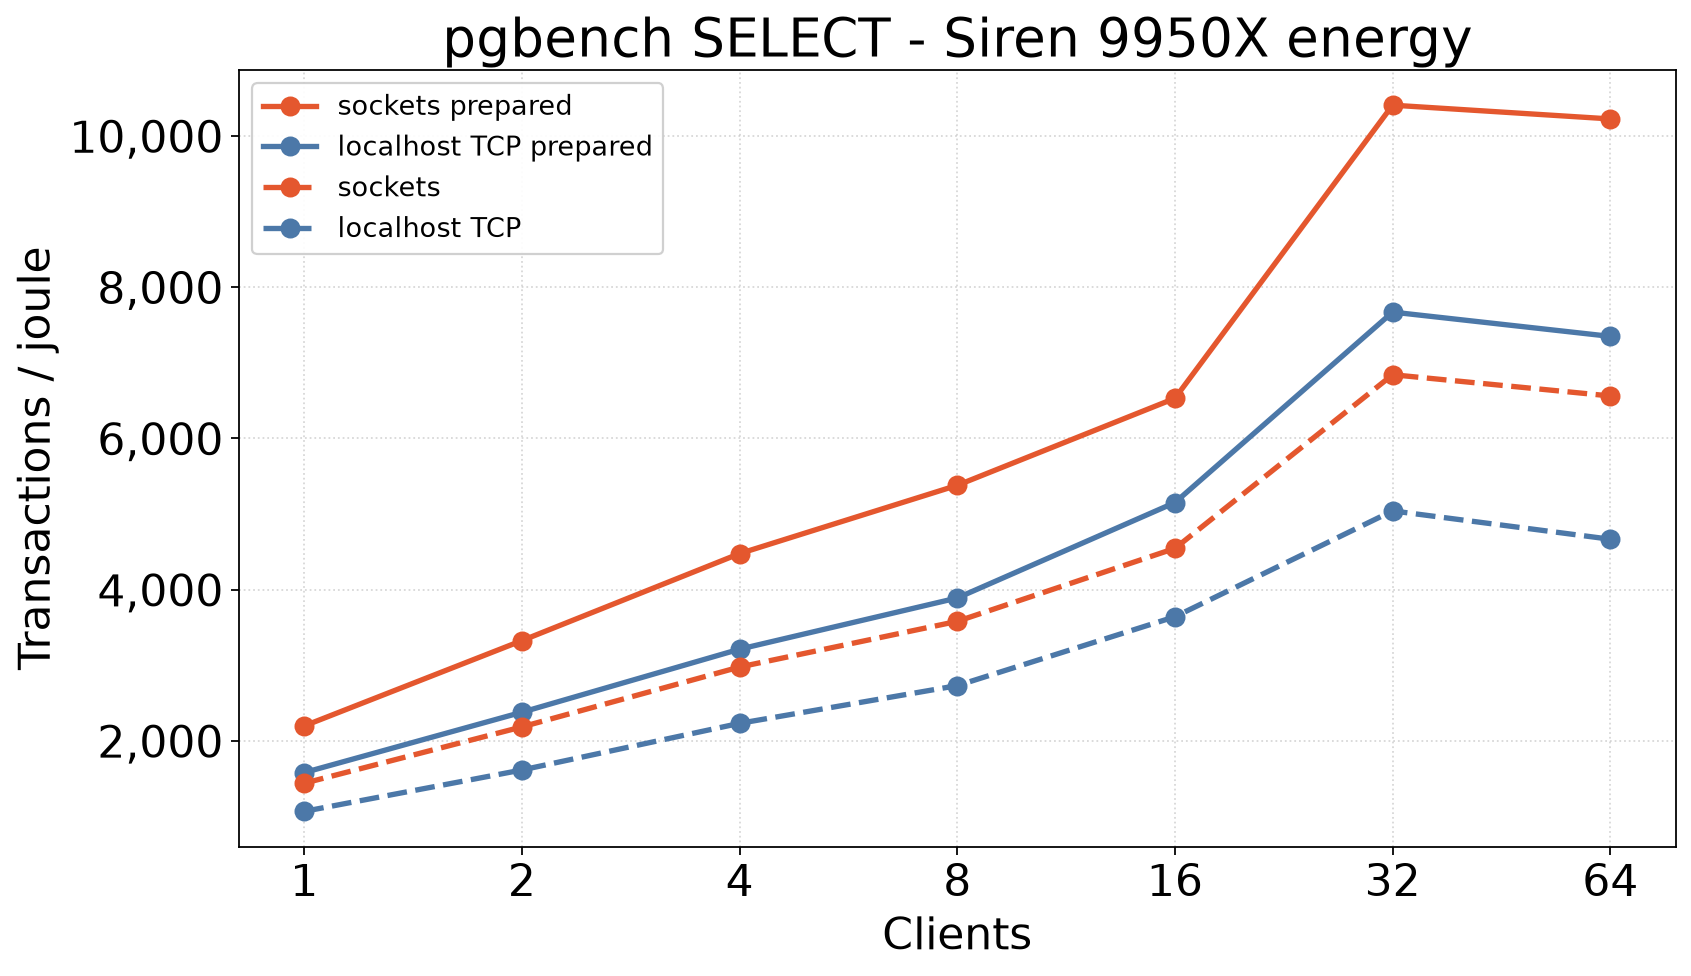
Mean across two SETTIMES. tps_1 is the single-client cell; tps_32 is the max on this chip.
| conn | tps_1 | pkg_1 | txn_j_1 | tps_32 | pkg_32 | txn_j_32 |
|---|---|---|---|---|---|---|
| sockets prepared | 132,433 | 60.9 | 2,196 | 2,058,653 | 199.6 | 10,406 |
| localhost TCP prepared | 96,566 | 61.7 | 1,579 | 1,517,063 | 199.6 | 7,669 |
| sockets | 89,241 | 62.7 | 1,438 | 1,354,200 | 199.6 | 6,841 |
| localhost TCP | 68,924 | 65.2 | 1,066 | 997,097 | 199.6 | 5,040 |
SELECT components
Same siren 19rc1 cell, with the fantasy scripts that strip the executor down. ; (SCRIPT=nothing) is protocol + BEGIN/COMMIT only. SELECT 1 (SCRIPT=constant) is a query with no table lookup. Accounts SELECT is the lookup on top. Sockets only for the fantasy pair (no localhost TCP pass on those yet).
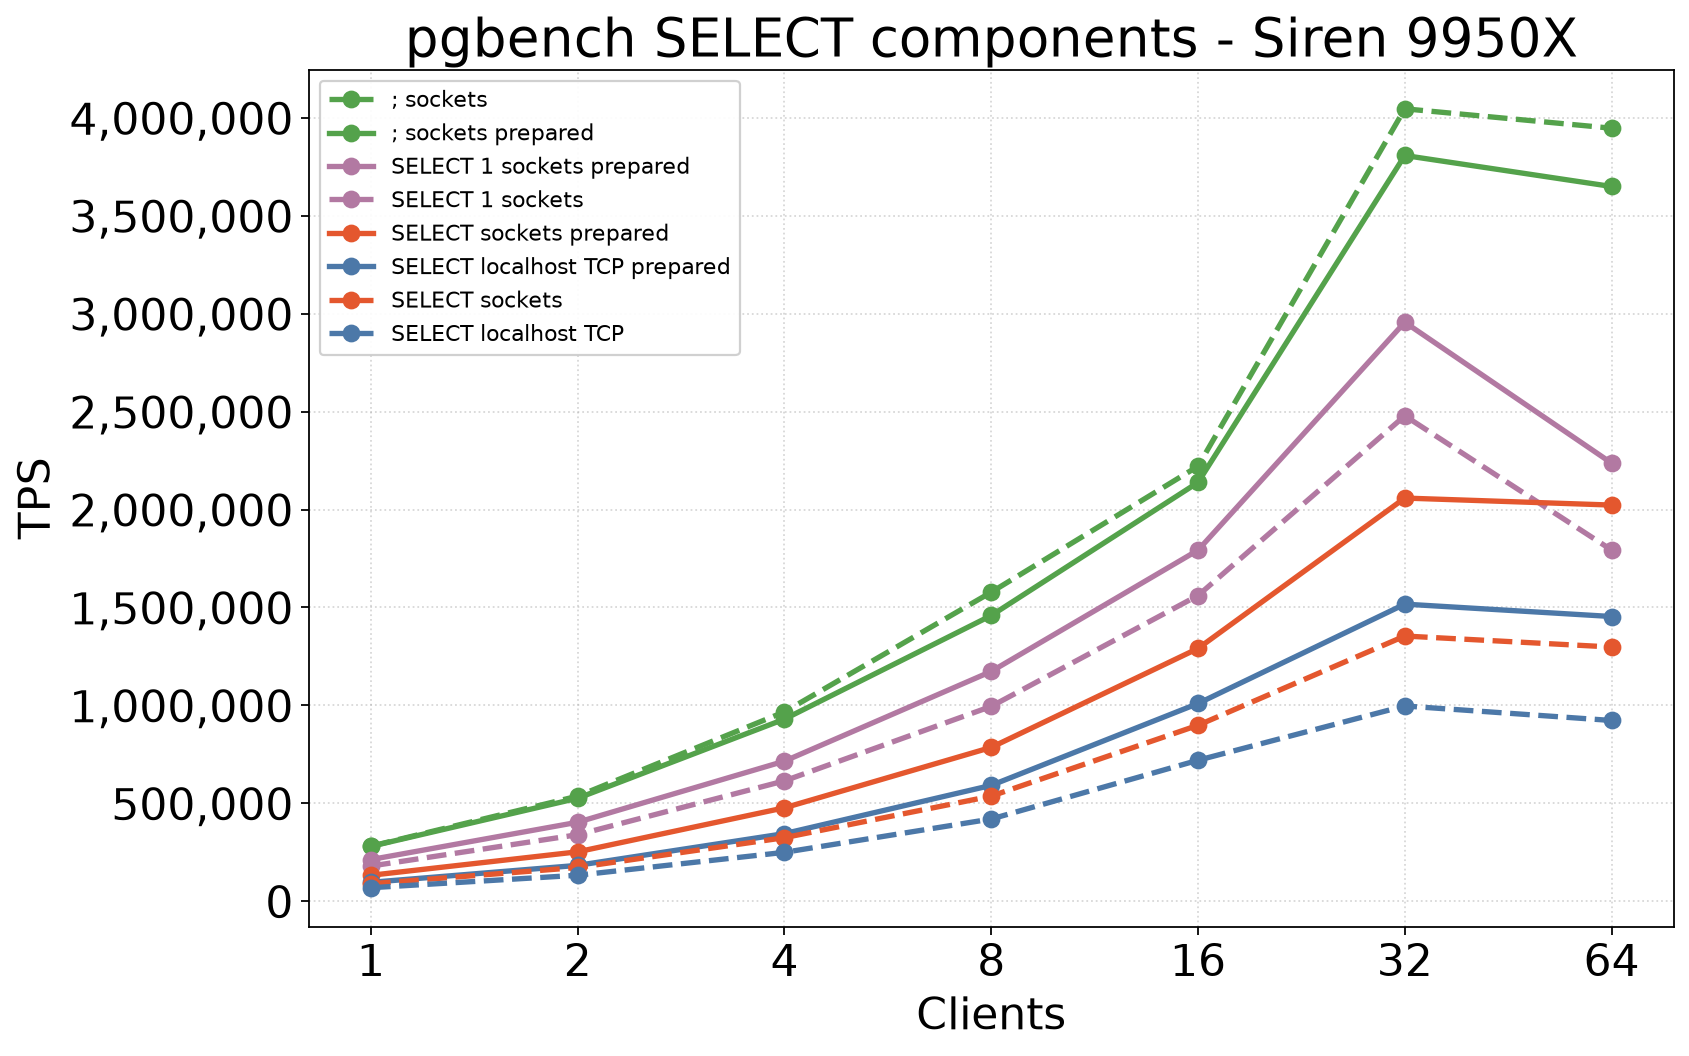
At 32 clients, sockets prepared SELECT is 2.06M; sockets ; is 4.05M — take the executor out and the rate almost doubles. SELECT 1 prepared (2.96M) sits between them. Simple (not prepared) query is the fastest way to do nothing (;). The prepared path is still doing protocol work with no plan to amortize it over. You’re paying for Bind/Execute steps instead of just spending those cycles on another empty nothing-results trip. The 1-client μs split that these curves come from: 1-client latency pieces.
Comparing versions
Hold conn_method constant. Mixing sockets with localhost TCP can look like a 25% hole; that was a test-method error on an early mixed latest_set, not debug assertions and not a version regression.
Fair 32-client means, same box:
| pin | conn_method | TPS |
|---|---|---|
| PostgreSQL 18.3 | sockets prepared | 2,013,812 |
| PostgreSQL 19rc1 | sockets prepared | 2,058,653 |
| PostgreSQL 19beta4 | localhost TCP prepared | 1,500,701 |
| PostgreSQL 19rc1 | localhost TCP prepared | 1,517,063 |
19 took the ranking cell with a tiny delta over 18 on sockets, and a similarly small step over 19beta4 on localhost TCP.
Court Spark four-face SELECT (set 7) is in the results DB as the ARM end of the same grid. Set 8 sockets ; / SELECT 1 is in: 1-client 100,843 / 94,911 nothing and 70,185 / 83,630 constant (simple / prepared). Not on this ranking table.
Regenerate ranking board: MPLBACKEND=Agg MPLCONFIGDIR="$PWD/.matplotlib-cache" .venv-graph/bin/python reports/select-leaderboard.py --from-db (reports/select-leaderboard.sql). Components chart: same prefix with reports/select-components.py (reports/select-components.sql). Older mixed-protocol dump: pgbench SELECT (PG18 snapshot).