OSM Power
OSM load throughput vs package power draw on the current Planet (10.79 billion nodes). R9 9950X and i5-13600K are PostgreSQL 19; Apple Studio and NVIDIA Spark are the same extract on 17 and 16. Package watts for the 9950X are turbostat PkgWatt from the corrected siren import.
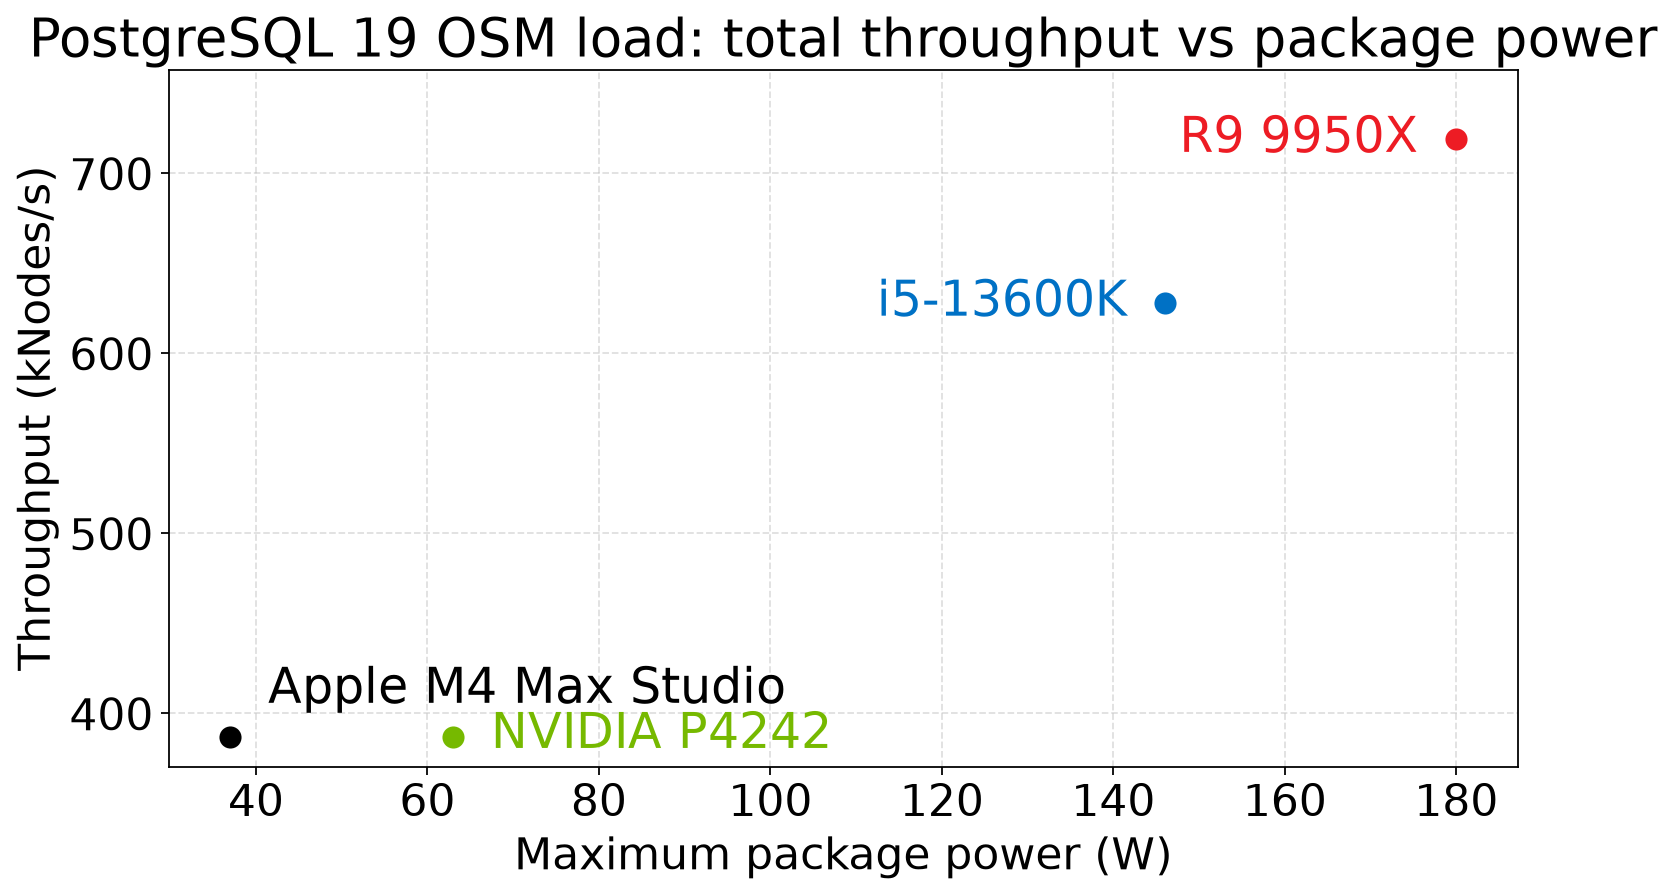
Each CPU is positioned by maximum package watts during the load. R9 9950X leads on raw total throughput at 719 kNodes/s and 180 W peak (PostgreSQL 19, fsync=off). i5-13600K is next at 628 kNodes/s and 146 W. Apple M4 Max Studio and NVIDIA P4242 both reach 387 kNodes/s, at 37 W and 63 W peak.
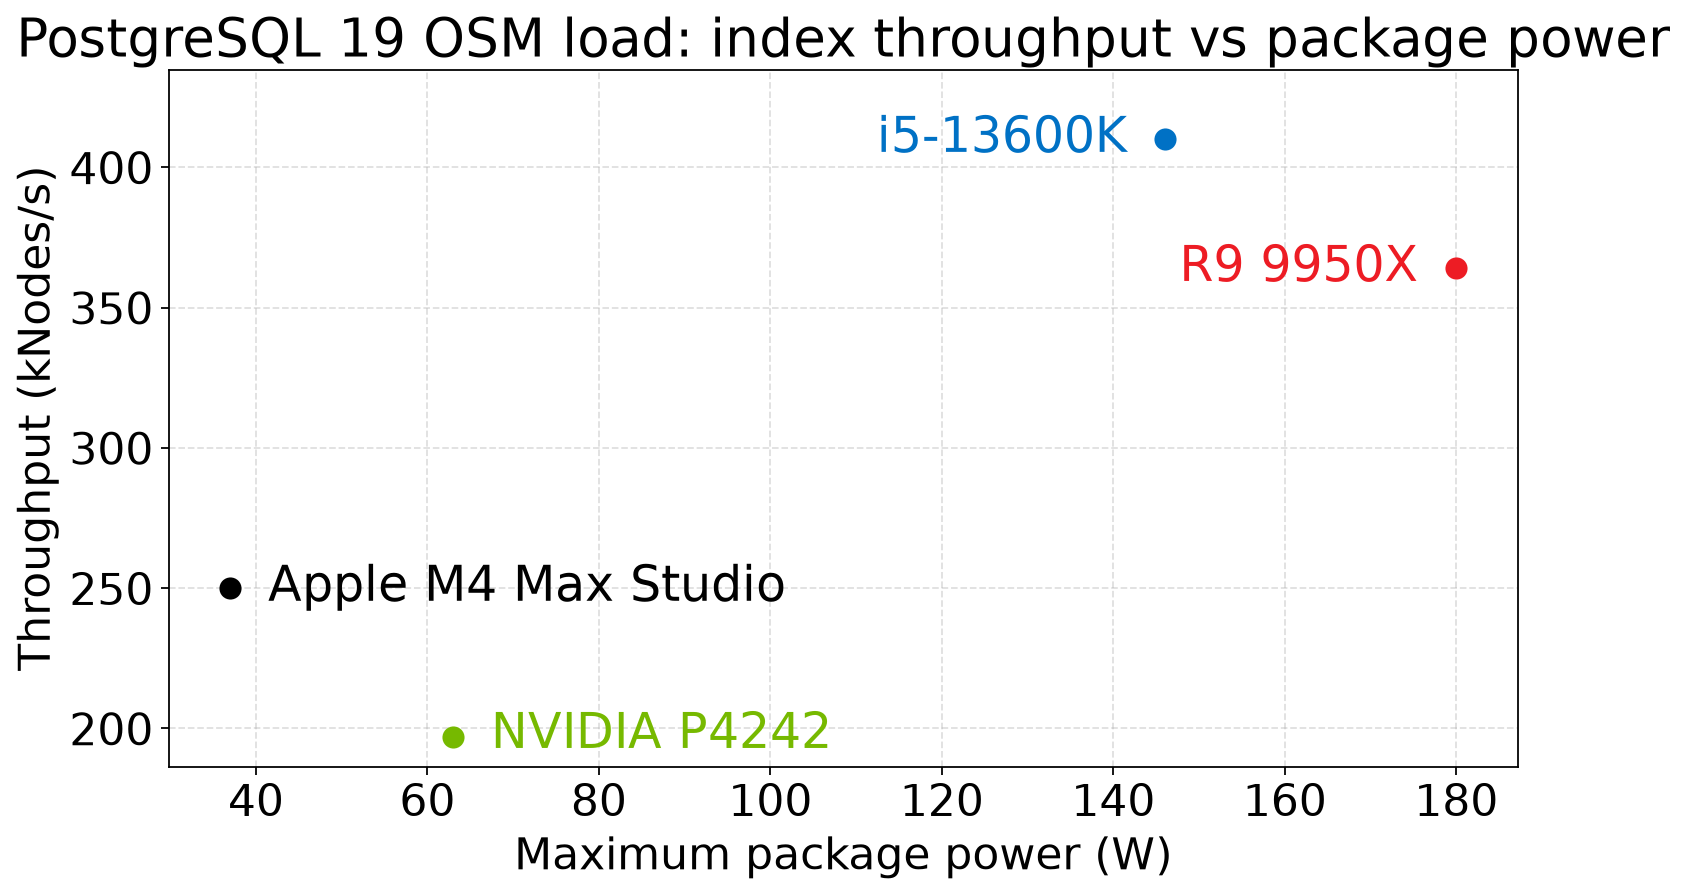
Index build only—i5-13600K leads raw index throughput at 410 kNodes/s; Apple M4 Max Studio is the efficiency story at 250 kNodes/s and 37 W peak.
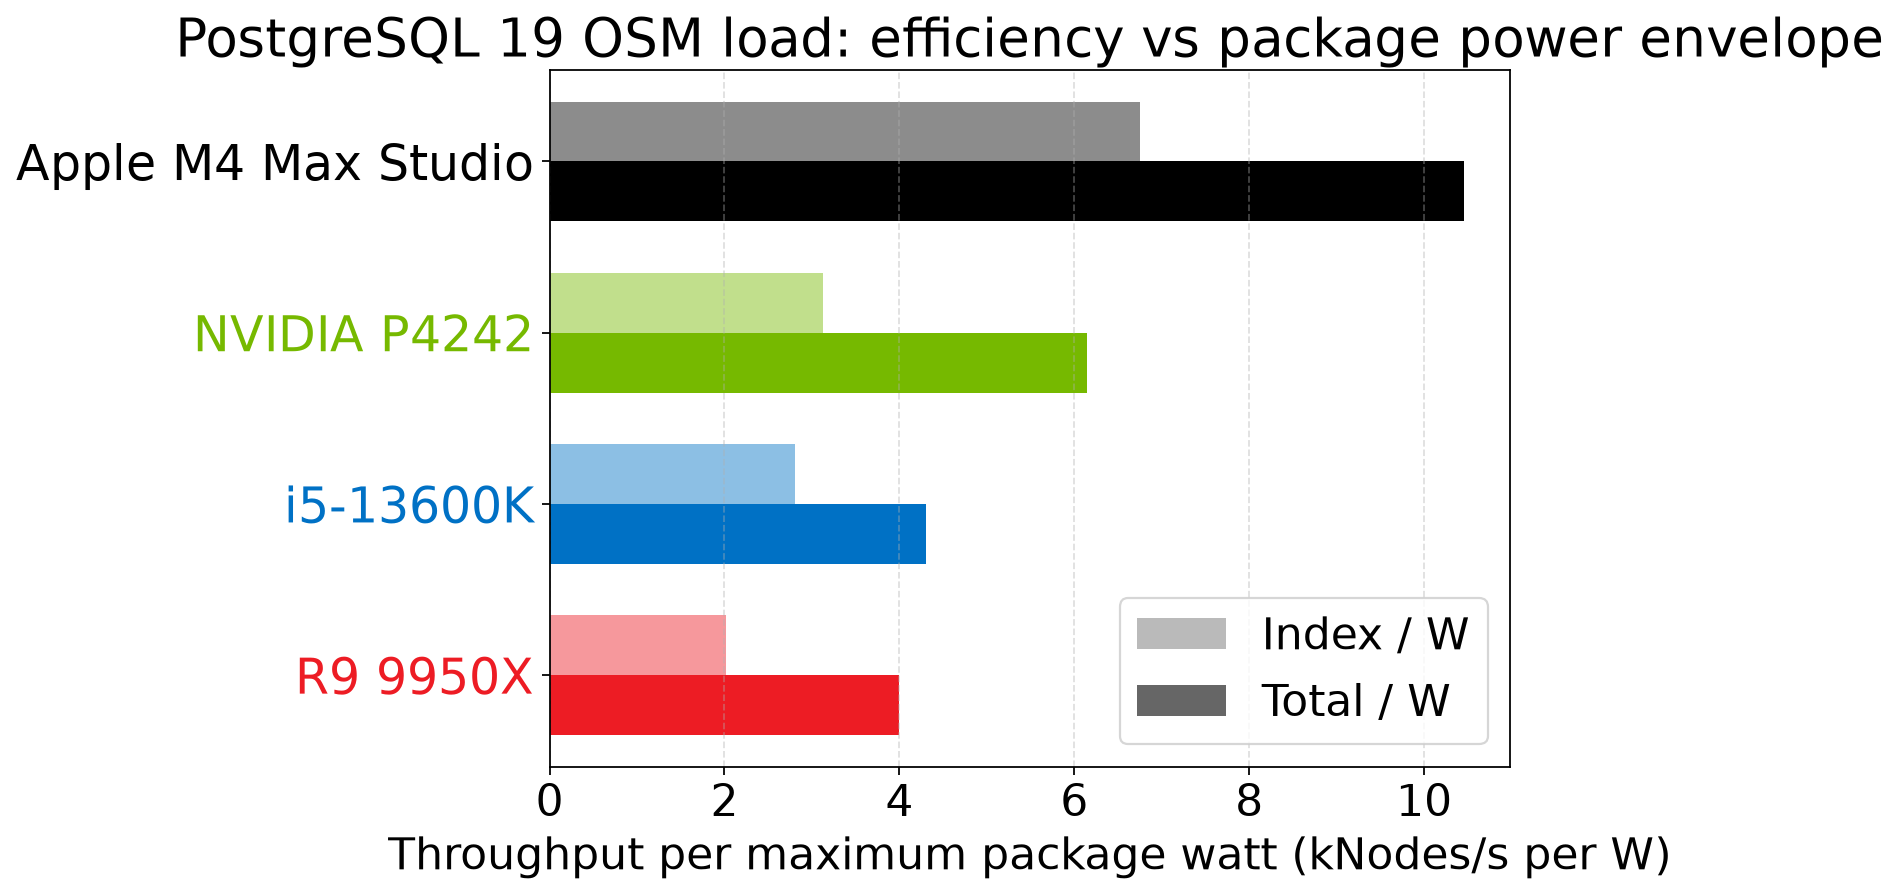
Throughput per peak watt favors Apple Silicon. Apple M4 Max Studio leads on both total and index load. NVIDIA Spark sits between the Apple box and the desktop Intel/AMD parts; the 9950X moves the most nodes overall at the highest envelope.
Regenerate throughput charts: MPLBACKEND=Agg MPLCONFIGDIR="$PWD/.matplotlib-cache" .venv-graph/bin/python reports/osm-power.py --pg 19 (reads the first table below). Query: reports/osm-power.sql.
Sets: siren 71 and twilight 118 (PG19 beta4); abbey 10 (New Planet 2026-08-13) and 11 (PG18); court 2 (New planet 2026-08-13).
Query returned 4 rows.
| cpu | mem_gb | ver | score_kips | overall_kips | index_kips | polygon_kips | line_kips | point_kips | node_kps | rel_ps | pwr_est | max_pkg | avg_pkg | fsync | wal_level | wal | avg_write | max_write | avg_read | max_read | cpu_c |
|---|---|---|---|---|---|---|---|---|---|---|---|---|---|---|---|---|---|---|---|---|---|
| R9 9950X | 124 | 19 | 1480 | 719 | 364 | 3925 | 8225 | 3731 | 20555 | 4529 | 180 | 70 | off | minimal | 20.4 | 79 | 7772 | 68 | 9748 | #ED1C24 | |
| i5-13600K | 188 | 19 | 1407 | 628 | 410 | 3551 | 7478 | 6707 | 14622 | 4590 | 146 | 48 | off | minimal | 17.8 | 51 | 9692 | 42 | 9342 | #0071C5 | |
| Apple M4 Max Studio | 128 | 17 | 578 | 387 | 250 | 2289 | 3400 | 6568 | 12725 | 1358 | 37 | 8 | off | minimal | 10.7 | 331 | 4159 | 331 | 4159 | #000000 | |
| NVIDIA P4242 | 119 | 16 | 504 | 387 | 197 | 1887 | 3578 | 3030 | 15071 | 1156 | 63 | 24 | off | minimal | 10.7 | 130 | 6115 | 111 | 6216 | #76B900 |
Relation power efficiency
Relation-build throughput during OSM planet load, normalized by average package watts over the full run (not peak).
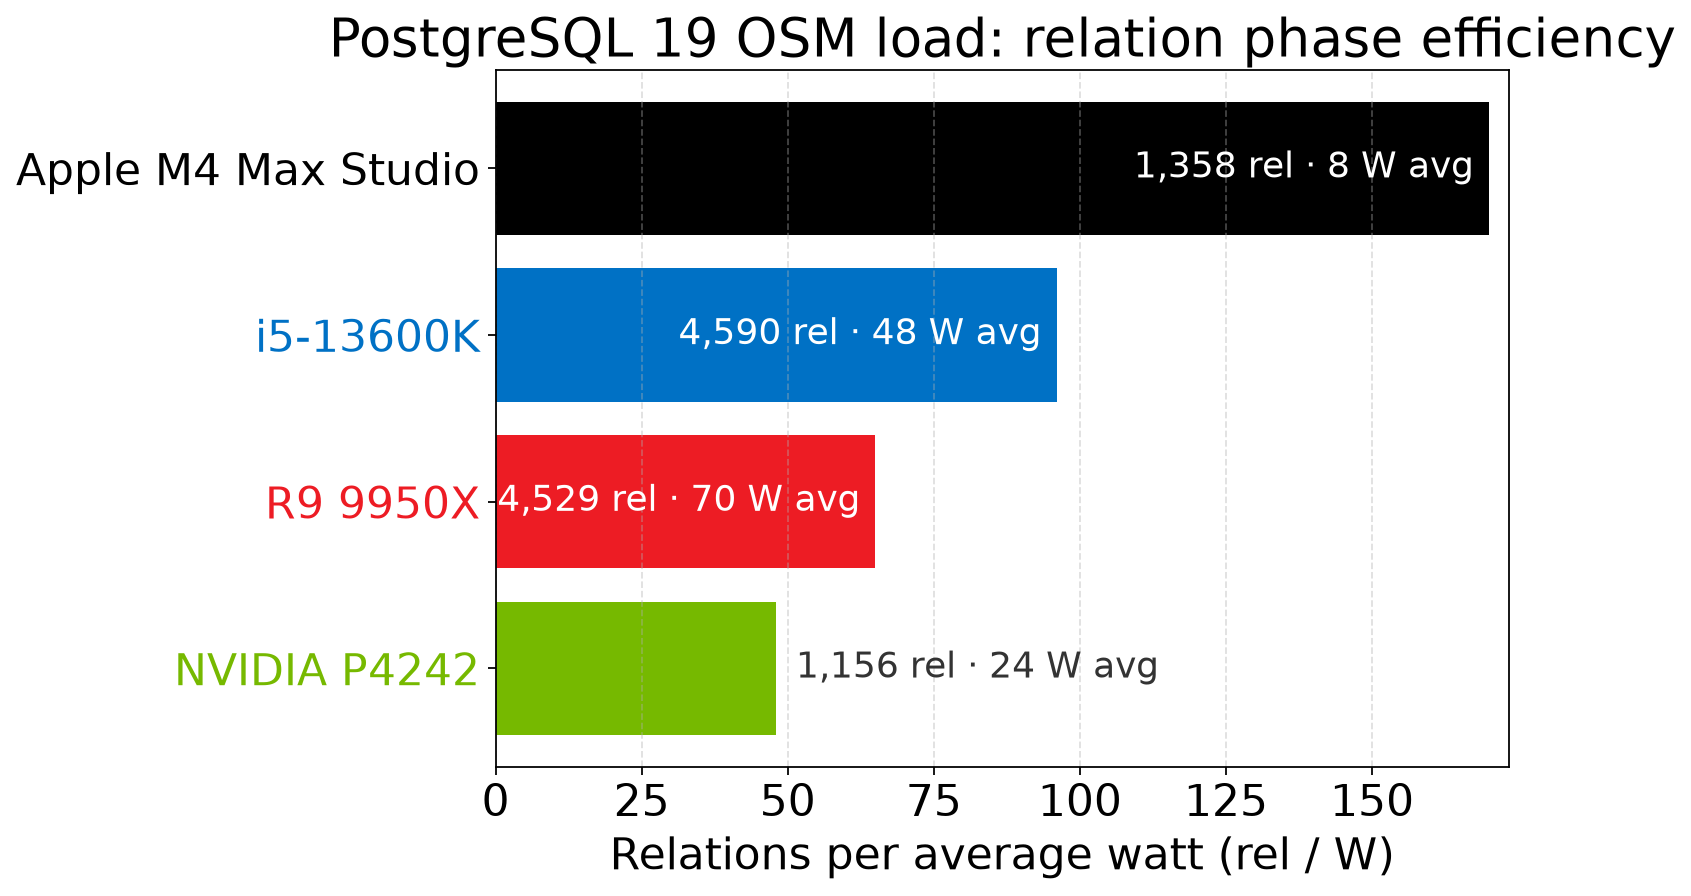
Apple M4 Max Studio leads at 170 relations per watt (1358 rel/s at 8 W average). i5-13600K is next among the desktops at 96 rel/W; R9 9950X moves the most relations overall (4529 rel/s) at 70 W average.
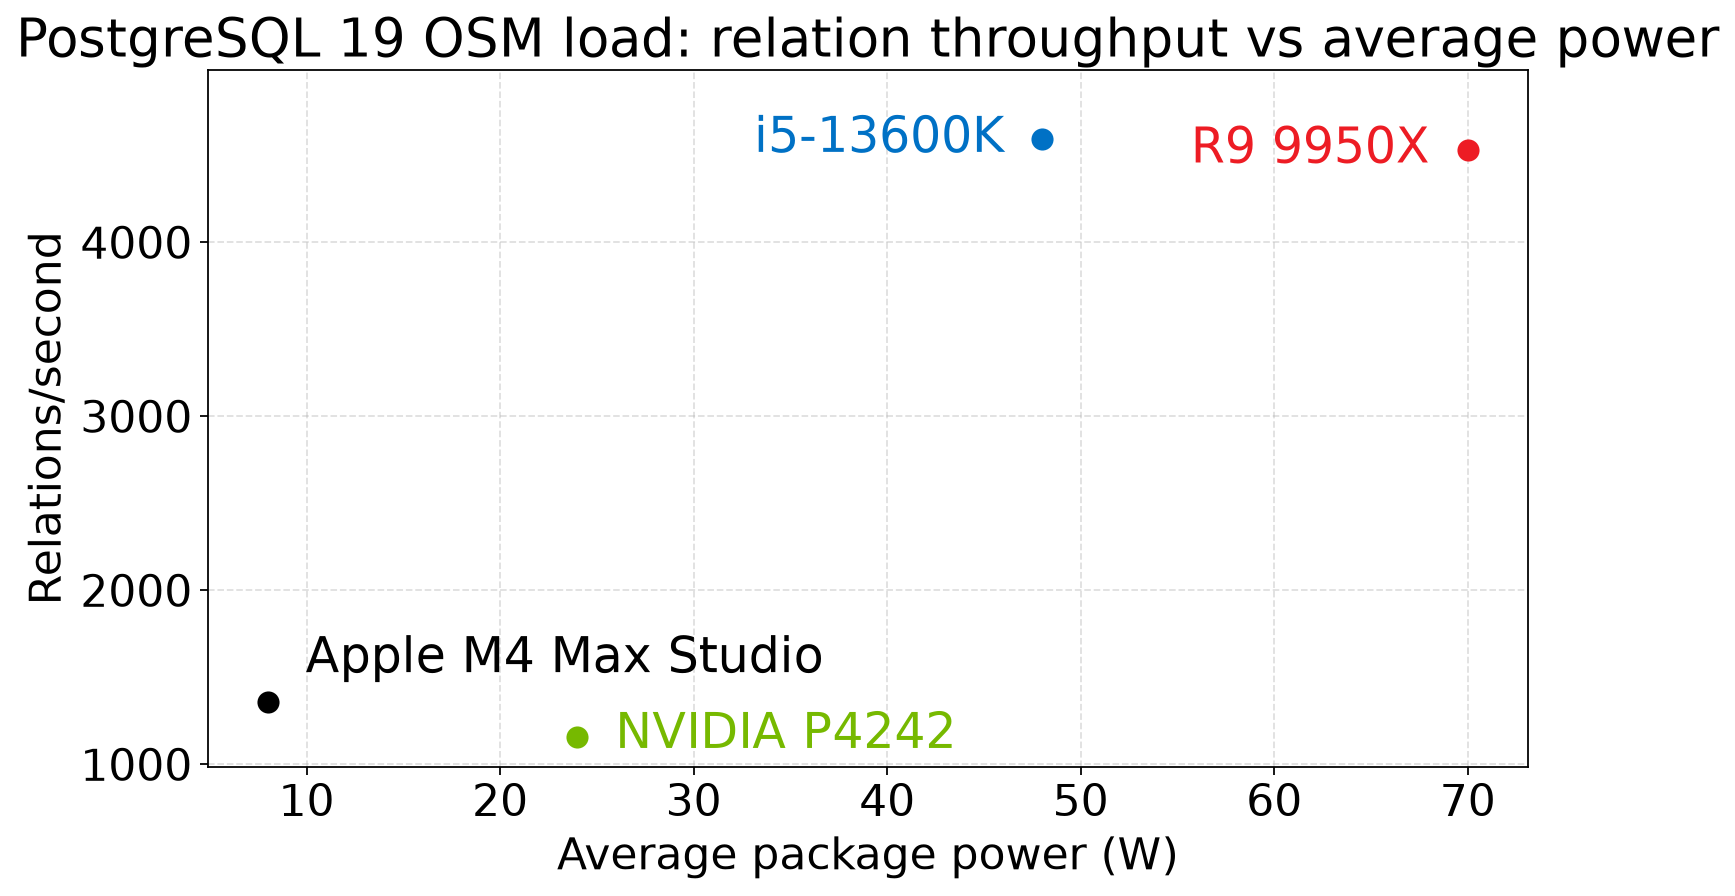
The scatter view shows the same data directly: desktop AMD and Intel sit at 48–70 W average with the highest relation rates; Apple stays in the lower-left with the best rel_per_watt.
Regenerate: MPLBACKEND=Agg MPLCONFIGDIR="$PWD/.matplotlib-cache" .venv-graph/bin/python reports/osm-relation-power.py --pg 19 (reads the relation table below).
| cpu | ver | rel | avg_watts | max_watts | rel_per_watt | cpu_c |
|---|---|---|---|---|---|---|
| Apple M4 Max Studio | 17 | 1358 | 8 | 37 | 170 | #000000 |
| i5-13600K | 19 | 4590 | 48 | 146 | 96 | #0071C5 |
| R9 9950X | 19 | 4529 | 70 | 180 | 65 | #ED1C24 |
| NVIDIA P4242 | 16 | 1156 | 24 | 63 | 48 | #76B900 |