pgbench SELECT Leaders: Performance vs. Power
TPS and package-power detail behind the SELECT section of the leaderboards page.
The standard Postgres on Linux SELECT lab numbers published are the Phoronix / OpenBenchmarking.org pts/pgbench. Some of the pgbent results are a comparable TPS. The OpenB-comparable SELECT cells run for 90s at pgbench scale 100 over Localhost TCP prepared. OpenB switched to -M prepared a few years ago (PTS pgbench 1.13) and that reset their public face. Numbers went up; query planning in Postgres takes time. OpenBenchmarking’s multi-million TPS numbers involve multi-socket systems on DC network hardware, not localhost and not unix sockets sharing the server with pgbench.
This lab still runs all four connection faces — sockets vs localhost TCP, simple vs prepared — so protocol overhead stays visible. Localhost TCP prepared is the Phoronix-shaped ranking cell. Hold conn_method constant when comparing versions — mixing sockets with localhost TCP can look like a 25% hole. See Comparing versions.
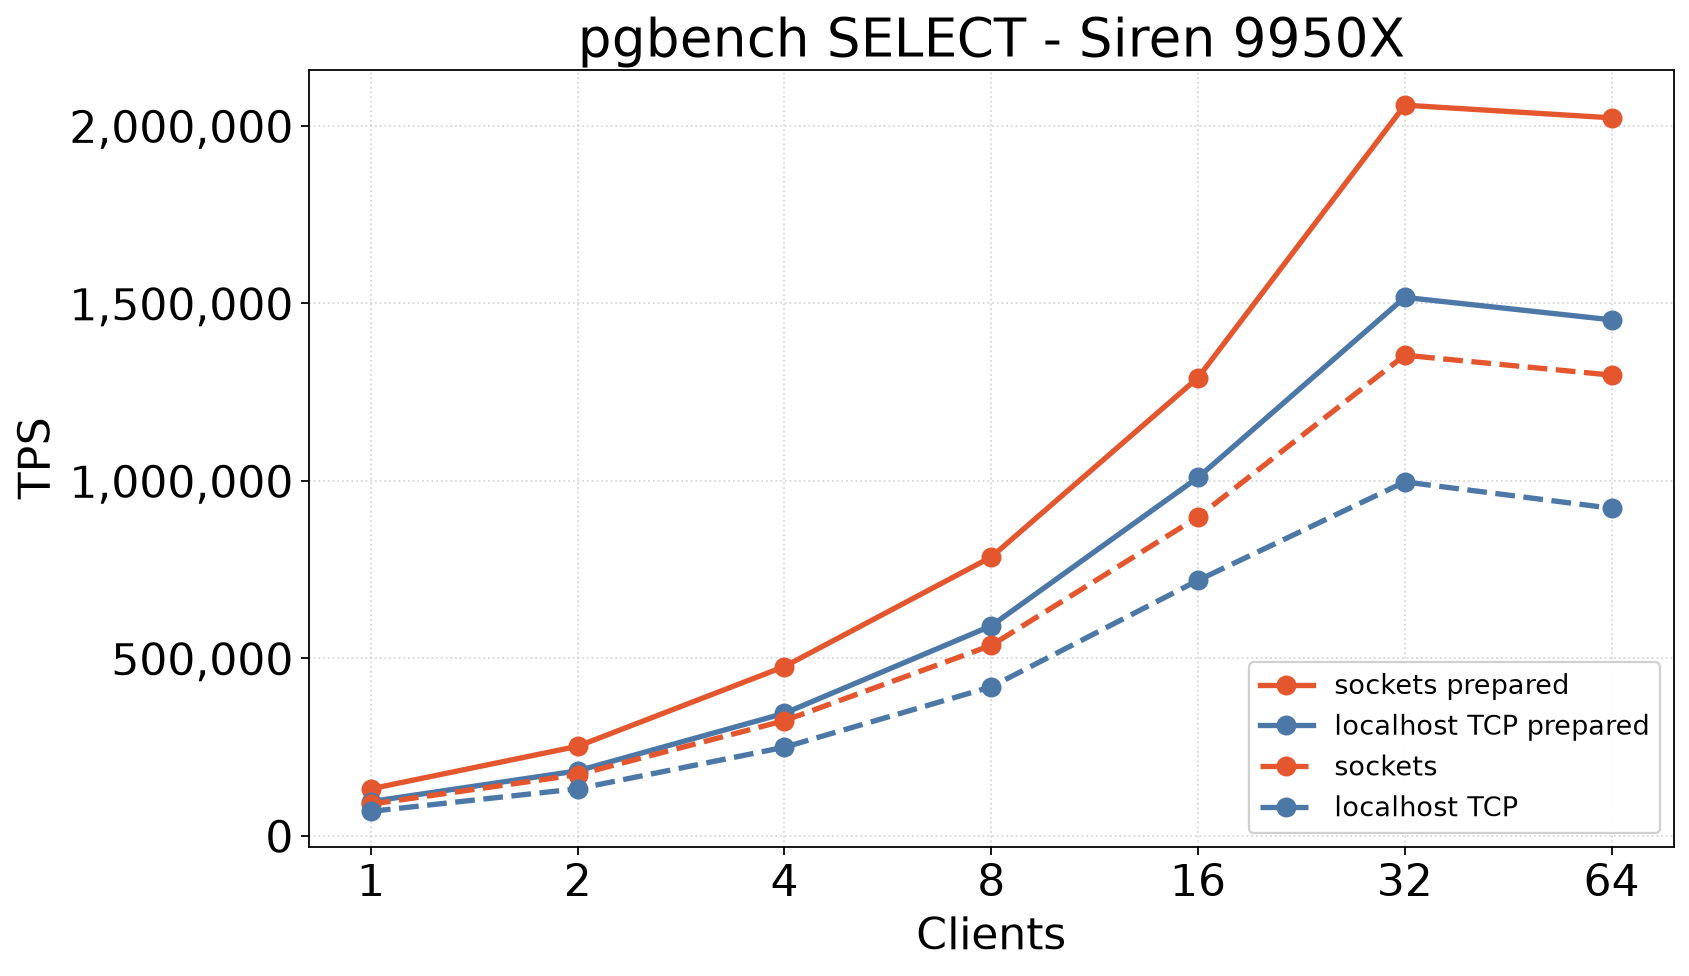
Starter board from siren (R9 9950X), PostgreSQL 19rc1 (rc1 2026-10-15, catalog 20261006), scale 100, 90s. Same box, four faces of the connection sweep: unix sockets vs localhost TCP, simple vs -M prepared. Peak is 32 clients, sockets prepared (2.06M TPS). Localhost TCP prepared sits at 1.52M (~26% below sockets). Package watts: 1-client is ~62 W; from 16 clients up the 9950X sits on the ~200 W PPT rail (RAPL avg 199.6, not a copied 200).
Package power sits on the same row as TPS on the sockets face (one machine, complete accounting). Combining client and server watts across boxes is out of scope—that’s the harder to observe data center shaped problem. Transactions per joule is the energy-efficiency number for each client count — the same 1-second PkgWatt integral as OSM kJ. Better performance is also more work per watt-second; the PG community cares about that as a virtuous side effect of code improvements, so this lab publishes it.
At 32 clients every face burns ~17.8 kJ in 90s — the sum of the 200W PPT rail. Sockets prepared does 10,406 txn/J; localhost TCP simple does 5,040. Same joules, twice the work. Energy efficiency is the other side of the protocol fan. Better performance spends the same watt-seconds on more useful work.
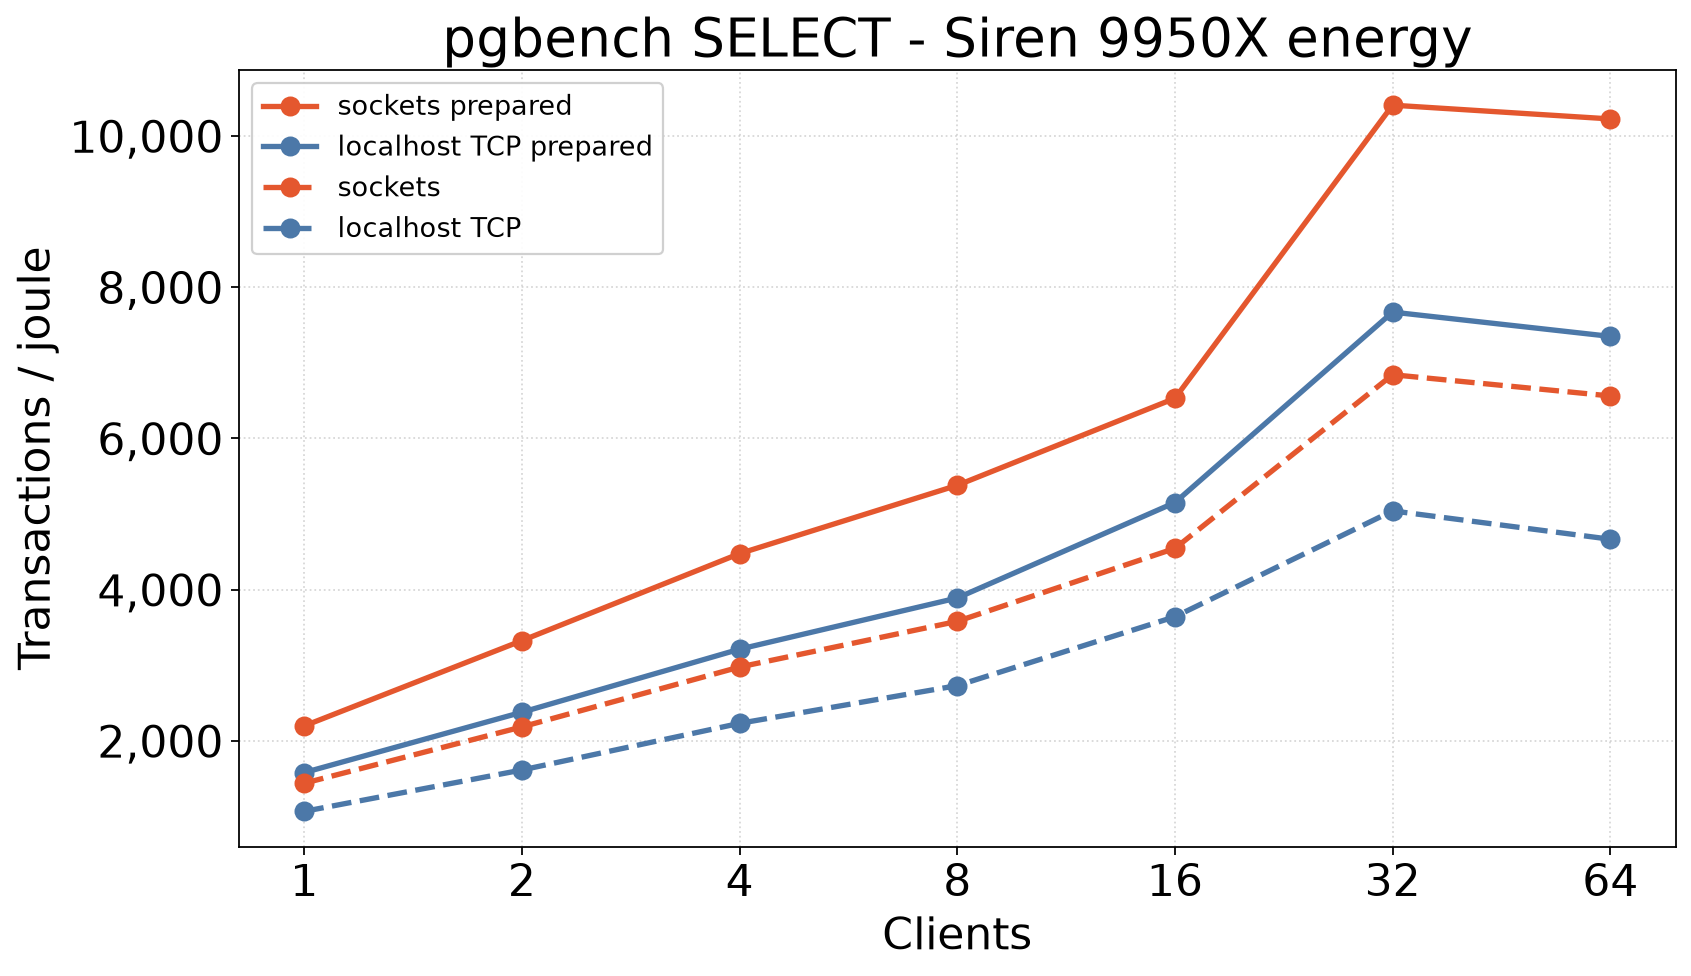
Mean across repeats (4 faces). tps_1 is the old single-core cell; tps_32 is the max on this chip. pkg_* is average package watts; txn_j_* is transactions per joule on those same runs.
| conn | tps_1 | pkg_1 | txn_j_1 | tps_32 | pkg_32 | txn_j_32 |
|---|---|---|---|---|---|---|
| sockets prepared | 132,433 | 60.9 | 2,196 | 2,058,653 | 199.6 | 10,406 |
| localhost TCP prepared | 96,566 | 61.7 | 1,579 | 1,517,063 | 199.6 | 7,669 |
| sockets | 89,241 | 62.7 | 1,438 | 1,354,200 | 199.6 | 6,841 |
| localhost TCP | 68,924 | 65.2 | 1,066 | 997,097 | 199.6 | 5,040 |
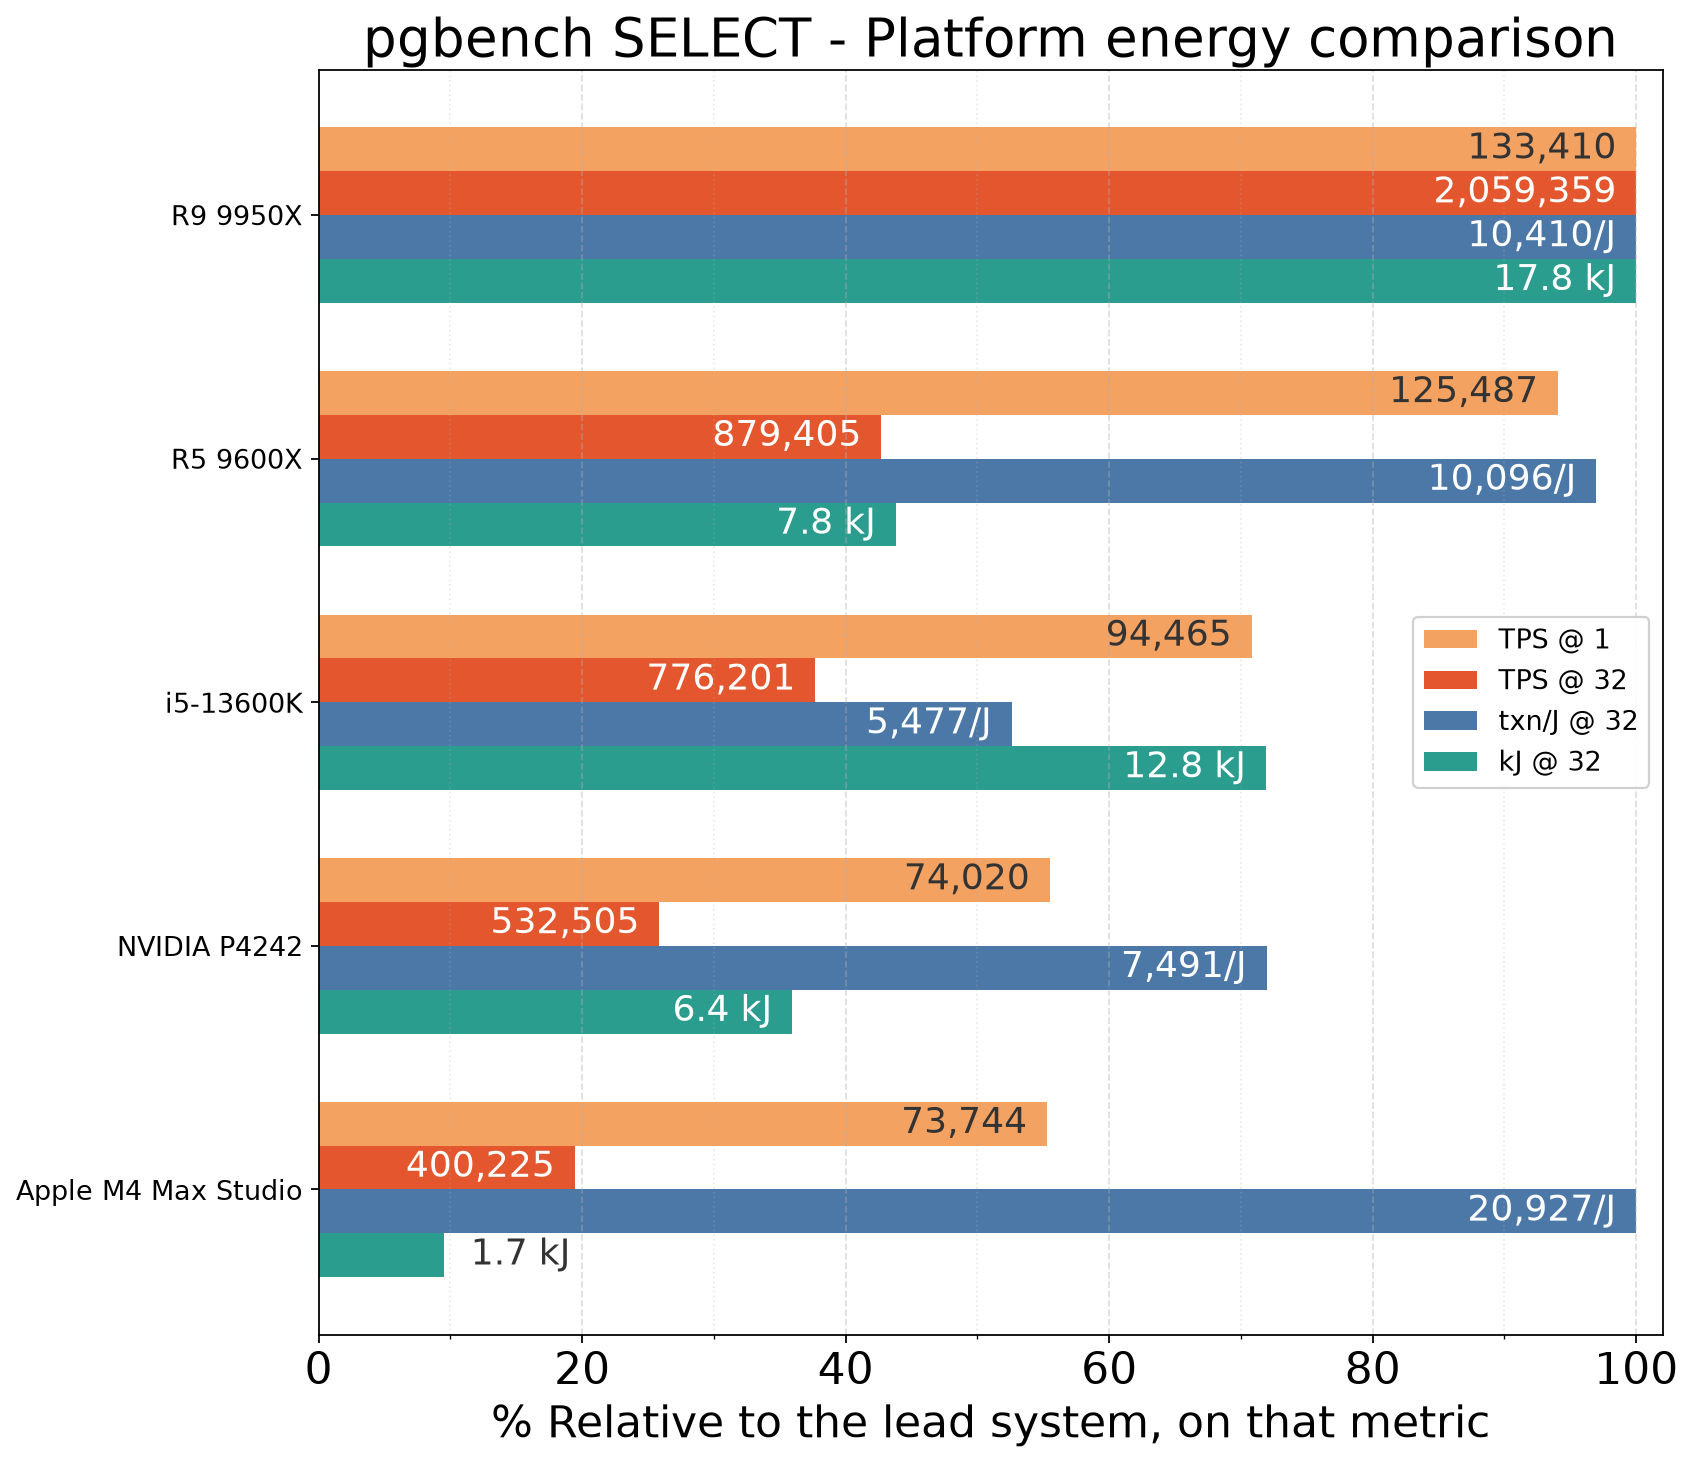
One chart for the best sockets prepared run on each machine at 1 and 32 clients. Bar length is relative to the lead system on that metric (100% = that system’s value); anything above the lead is drawn at 100%. Labels and the table are the raw values. A longer kJ bar means more energy used, not more efficiency. txn/J is transactions per joule on the same 32-client run — total transactions over total package joules.
| cpu | tps_1 | txn_j_1 | tps_32 | txn_j_32 | kJ_32 |
|---|---|---|---|---|---|
| R9 9950X | 133,410 | 2,219 | 2,059,359 | 10,410 | 17.8 |
| R5 9600X | 125,487 | 3,034 | 879,405 | 10,096 | 7.8 |
| i5-13600K | 94,465 | 3,015 | 776,201 | 5,477 | 12.8 |
| NVIDIA P4242 | 74,020 | 3,732 | 532,505 | 7,491 | 6.4 |
| Apple M4 Max Studio | 73,744 | 15,917 | 400,225 | 20,927 | 1.7 |
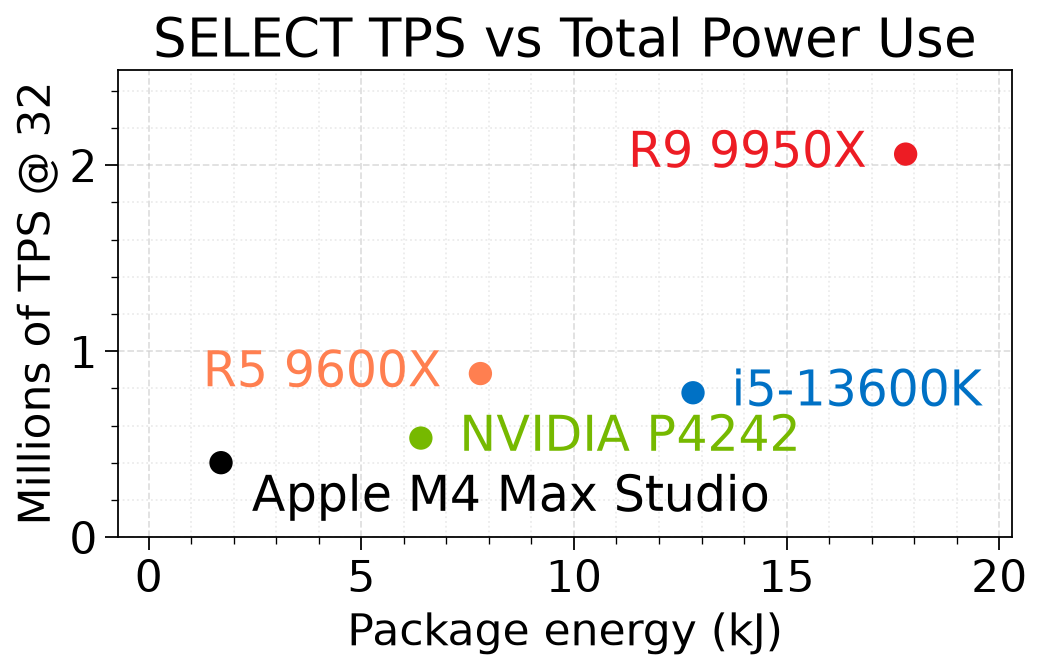
Speed vs energy for the best sockets prepared run on each machine at 32 clients. TPS is the SELECT rate; kJ is total package energy from the 1-second power integral over the 90s window. Same pin cells as the comparison bars above.
R9 9950X does 2,059,359 TPS at 17.8 kJ; Apple M4 Max Studio does 400,225 at 1.7 kJ (5.1× TPS, 10.5× joules). Versus NVIDIA Spark the TPS ratio is 3.9× (2,059,359 vs 532,505).
Sockets prepared SELECT TPS at scale 100 (90s pin cells; court dense fill 180s), one series per CPU (best repeat at each client count). Colors match the OSM efficiency vs package power envelope chart.
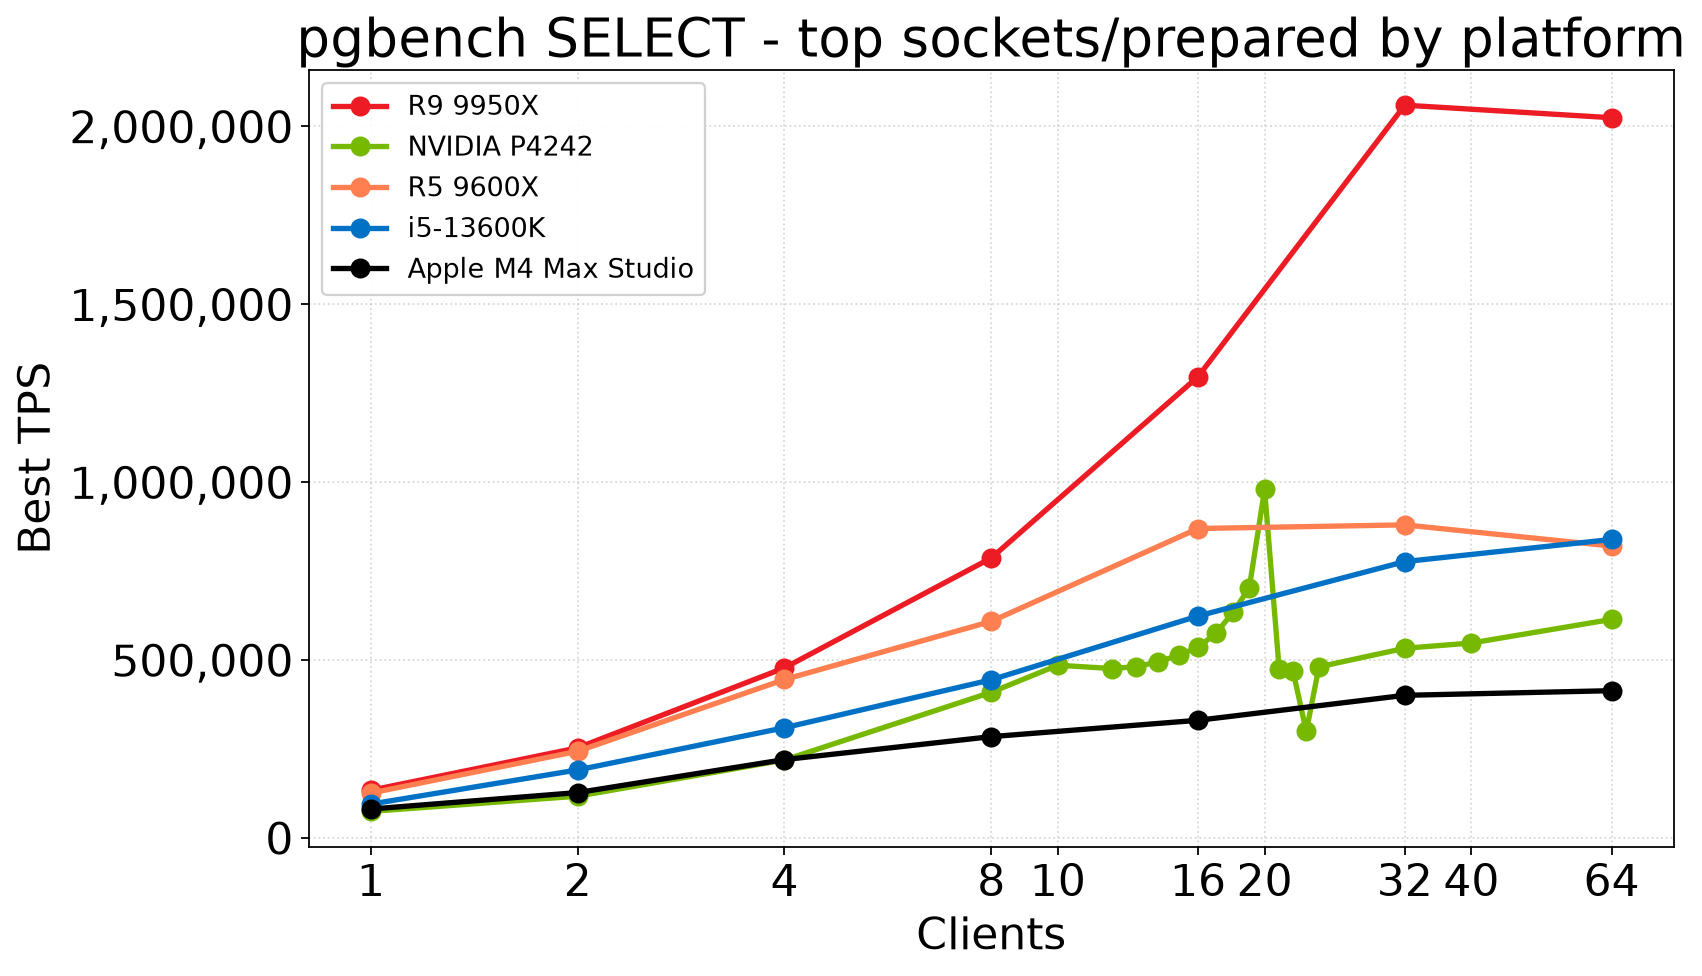
5 platforms: siren R9 9950X (PG19 rc1) and R5 9600X (set 118), twilight i5-13600K, court NVIDIA P4242, abbey Apple M4 Max Studio (PG18).
A power-of-two-only client grid is not vendor-neutral on this farm: it gives a mild advantage to the current AMD set (e.g. 9950X lands cleanly on 16 / 32), while mixed-core / big.LITTLE boxes need nproc points or they look artificially soft. Court’s sockets-prepared ladder is the textbook case: ~485k at 10 / 16, then ~979k at 20 (nproc), with 32 falling back to ~533k. Dense fill set 31 (every client 12–24, three 180s repeats, best TPS) makes the cliff obvious: climb through 19 (~702k), spike at 20, then collapse to ~475k @21 / ~299k @23 before a partial bounce at 24. Max latency explodes at 21–22 (~100–160 ms) while the slow 23 cell stays milder (~40 ms) — a different scheduling regime, not just “worse of the same.” pgsysinfo already adds nproc, 2×, and 4× to SETCLIENTS for that reason. Earlier fills (sets 26 / 27) put 10 / 16 / 20 / 40 on the chart; 31 densifies the ragged band. Twilight’s 13600K shows a milder version of the same edge; once other pending farm work finishes, its SELECT grid will pick up the pgsysinfo thread points (20 / 40 / 80) so pgbench can pin better to cores and threads — same fairness fix as court. Apple is milder still. After the 14900K left the farm, AMD chips moved onto the top of this board. Spark is still a relatively raw CPU platform here, so the power-of-two-only grid undersells it.
; (SCRIPT=nothing) hits 280K TPS on a single client (simple 281,019, prepared 280,201) and peaks at 4.05M simple / 3.81M prepared at 32 clients — the protocol ceiling. That’s web scale. No query to plan, so preparation does not help; at many clients simple is a few percent ahead. Sockets constant (SELECT 1) at one client is 212,745 prepared (4.7 μs) / 179,635 simple (5.6 μs), and peaks at 2.96M prepared / 2.48M simple at 32. Execute of that query is +1.1 μs, planning it +0.9 μs, accounts lookup +2.9 μs on top. Unlike ;, preparation helps SELECT 1. At one client the rates are just the inverse of the latency times. Breakdown: 1-client latency pieces. Not on this ranking.
Sockets
Unix-domain connections (SOCKETS=1). Clients run on the server. This is the power-ranking cell. Localhost TCP prepared is the Phoronix-shaped face.
Networked
Localhost TCP (host) on this starter chart is protocol overhead on the same box, not a dedicated client. Unthrottled remote TCP is the face that can exceed on-box rates once the link is faster than ~10Gb/s. See OSM Network Study for link rate comparisons.
Regenerate: MPLBACKEND=Agg MPLCONFIGDIR="$PWD/.matplotlib-cache" .venv-graph/bin/python reports/select-leaderboard.py --from-db (runs reports/select-leaderboard.sql, reports/select-platform.sql, and reports/select-platform-faces.sql; faces, compare bars, TPS-vs-kJ scatter, and platform client ladder). Cross-major sockets-prepared trend: Leaderboards § History. 19rc1 snapshot: pgbench SELECT (PG19). Older mixed-protocol grid: pgbench SELECT (PG18 snapshot). Workload notes: pgbench SELECT.