pgbent
pgbent is a benchmarking toolkit for PostgreSQL hosted at github.com/gregs1104/pgbent. It runs repeatable workloads, collects system and database metrics at one-second resolution, and stores everything in a results database for regression testing, tuning studies, and long-term performance history.
As a performance regression tool, pgbent has helped catch packaging and integration issues across PostgreSQL releases 16–18. Years of trace history document how Postgres—and the hardware it runs on—has progressed in both software and storage performance.
Leaderboards — OSM planet load and pgbench SELECT rankings. Updated when new cells land; PostgreSQL 19 will be announced there.
How it works
While a workload runs, pgbent records system activity and a package of PostgreSQL internals—pg_stat_statements, pg_buffercache, and any custom SQL you attach. Metrics land in a separate results database, where summary SQL gives immediate feedback and Python/Pandas scripts draw workload summaries and per-metric time series.
When pgbent runs on the database server itself, it captures hardware and OS configuration and uses that to help size workloads. The included example metric query records client counts; you can change or extend it to watch anything readable via SQL.
Shell scripts (benchwarmer, runset) orchestrate each run. Scale and client combinations that share a common configuration—one postgresql.conf, one software build, one hardware platform—are grouped into a test set for comparison. See How pgbent works for more on metrics collection and test-set organization.
Highlights
- Orchestrated test runs — Automate pgbench client × database-size grids and arbitrary custom workload scripts.
- Deep metrics collection — One-second resolution sampling into a PostgreSQL results database, without monitor averaging that hides peak GB/s behavior.
- Human-readable internals — Metrics grade how effectively each test stresses CPU and storage, useful for tuning training and regression diagnosis.
- Configuration capture — Server hardware, OS details, and PostgreSQL settings recorded with every run.
- SQL and visual analysis — Reports in the
reports/directory; the leaderboards page is the public ranking; PostgreSQL 18 results keep the full study tables. - Easy to extend and audit — Workloads are plain scripts; the metrics system is transparent shell and SQL.
Workloads
pgbent includes a mix of fixed-size and automatically scaling workloads. Traces are collected over time as new software and hardware are introduced.
| Workload | What it exercises |
|---|---|
| pgbench grids | SELECT, UPDATE, and init workloads across client × database-size grids; graphs transaction rate, latency, and set comparisons |
| OpenStreetMap import | Real-world bulk load via osm2pgsql—COPY, index builds, checkpoint pressure |
| Complete Block Check (CBC) | Short synthetic storage stress test (CTAS, VACUUM, CLUSTER, index scans) |
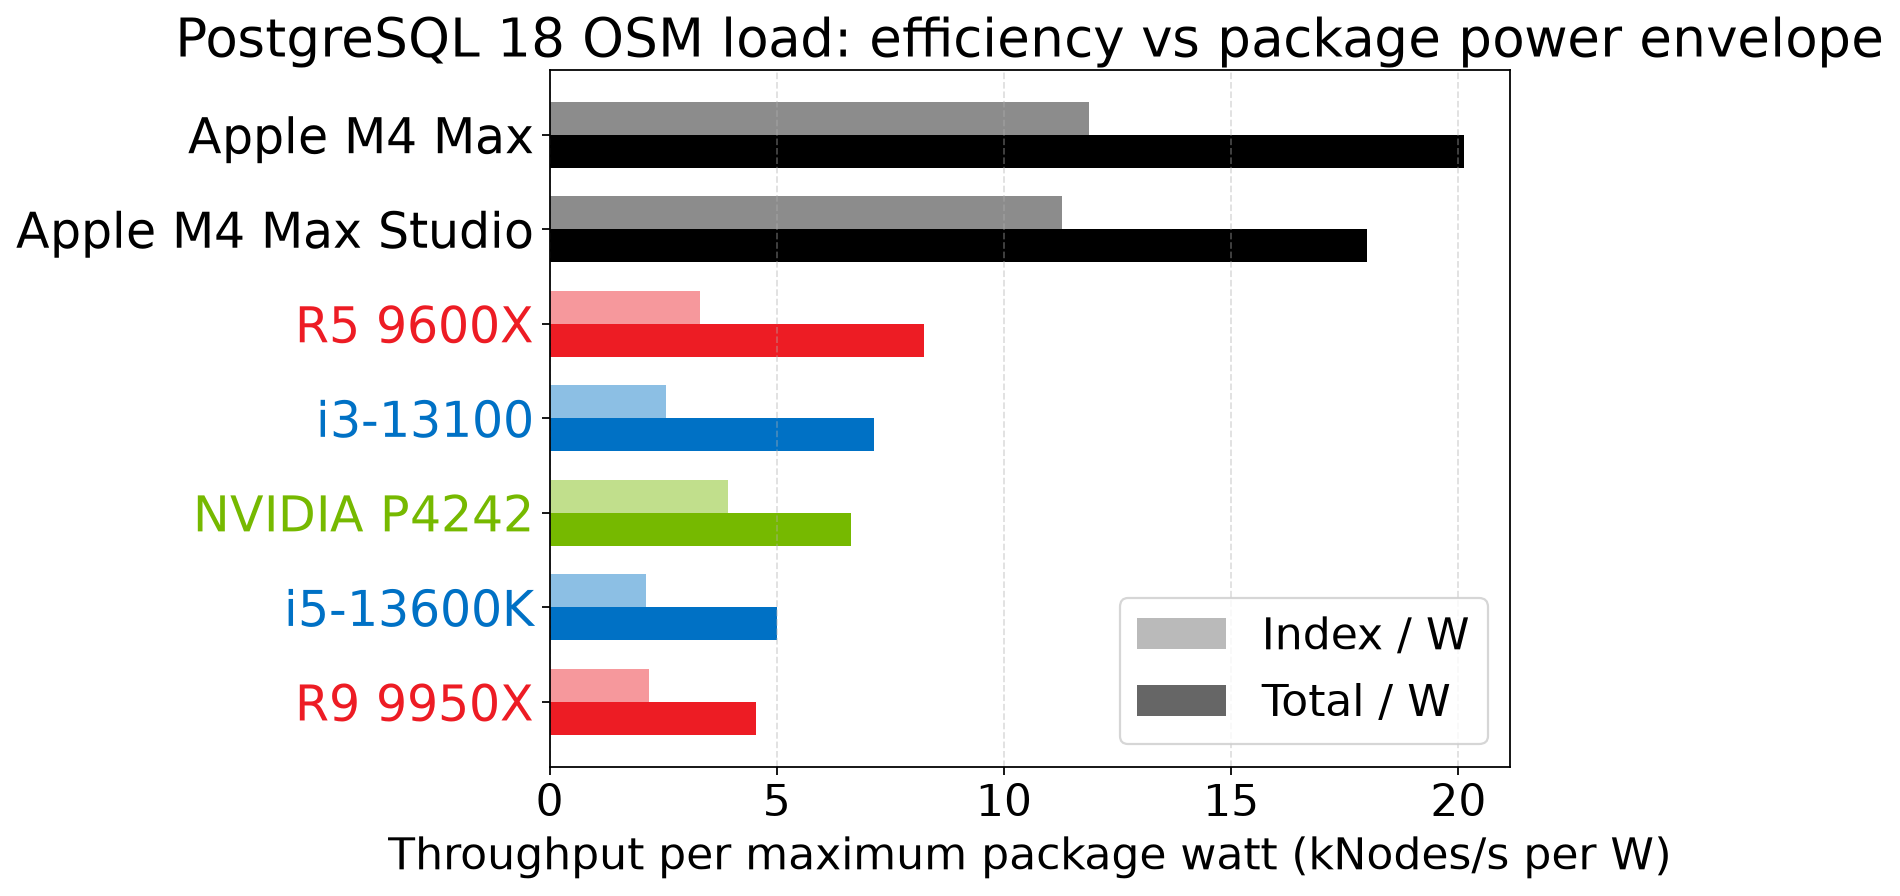
The OSM loader workload has produced the most interesting recent results, published as blog posts, talks, and social media threads. CBC runs anywhere—from a psql session to the Postgres Playground.
Tuning research
Sample results validate and extend the standard PostgreSQL tuning guide. The Tuning Model section documents studies of parameters that respond predictably to pgbent workloads:
- shared_buffers — buffer cache sizing and the ¼-RAM recommendation
- max_wal_size — WAL volume and checkpoint write smoothing
- checkpoint_timeout — checkpoint frequency trade-offs
- Linux dirty memory and pdflush / writeback — OS-level writeback behavior during heavy loads
Reference tuning configurations for OSM workloads live in the conf/ directory.
Getting started
- Clone pgbent from GitHub.
- Set up the test and results databases.
- Run tests with
./runsetor./benchwarmer. - Review results with SQL reports or
./webreport.
See also: Reports, Version compatibility, and Troubleshooting.
Design philosophy
Most benchmark tools model workloads as new arrivals replacing every departure—a theoretical queue you rarely see in production. Real systems arrive at a rate set by their own clock logic: batch jobs on a schedule, ETL pipelines, replication lag catch-up, and application-driven bursts.
pgbent workloads aim to reflect that reality. Databases have a broad set of use cases—read-heavy web, OLTP stores, analytics—and each has enough dimensions that workloads must be precisely modeled to match. pgbent provides calibrated, auditable workloads that target known strong and weak spots of modern storage, and that respond predictably to database tuning.