Linux Dirty Memory: testing
The primary write cache on a Linux PostgreSQL server is labeled Dirty memory. Operations that can dirty a lot of memory include index building, vacuuming, CLUSTER, and heavy random UPDATE statements. Dirty data eventually turns into Write-Back for a brief period, but the important metric to watch is the Dirty amount.
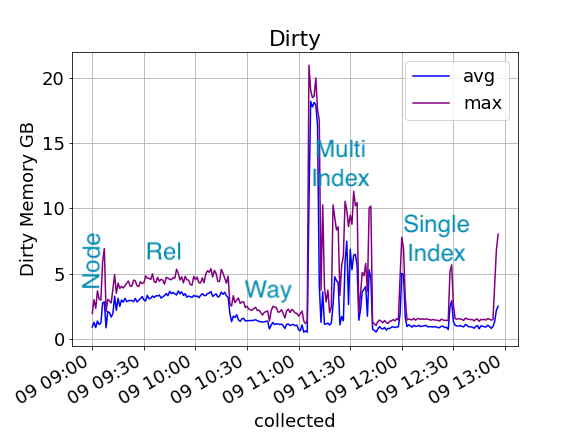
Much of the testing of the osm2pgsql loader was done with 128GB of RAM, and as expected that tries to keep dirty memory under 10% ~= 12GB while allowing bursts up to 20% ~= 24GB:
Having a bigger write cache allows speedups like combining, sorting, and reducing repeat IOPS during re-writes to the hot areas. But it also takes away memory from the read side of the system, which also has value. So whether a large Dirty memory write cache is good or bad depends on the capabilities of the underlying storage to do write IOPS reducing work. On a fast SSD, I/O reduction techniques don’t have as much value. The slower your storage, the more a big write cache helps.
Performance Impact
The performance study is available on the pgbent Streamlit app under the option “OSM Dirty Memory”.
Since this test server is using a fast SSD, there is only a small performance win to caching large amounts of Dirty memory:
| Setting | max_dirty | hours | nodes_kips | index_kips |
|---|---|---|---|---|
| Default ratios 10/20 | 14,405,595,136 | 3.14 | 710 | 310 |
| Dirty ratios 5/10 | 7,828,504,576 | 3.19 | 700 | 306 |
| Dirty ratios 2/4 | 2,750,353,408 | 3.16 | 707 | 304 |
| Dirty ratios 1/2 | 1,414,533,120 | 3.16 | 707 | 306 |
| Dirty bytes 1000MB/500MB | 992,743,424 | 3.20 | 699 | 295 |
| Dirty bytes 500MB/250M | 481,751,040 | 3.17 | 705 | 300 |
| Dirty bytes 100MB/50MB | 99,667,968 | 3.20 | 699 | 294 |
There is a mild performance regression limiting Dirty memory to under 1GB. Since this drive can burst multiple gigabytes in a second, you need a few GB to keep it optimally primed.
Settings change walkthrough
This section documents exactly how that study was performed, to show how the settings changes work out in practice.
Default 10/20 settings
The standard Linux settings allow 10 to 20% of RAM to fill with Dirty data before writing it more aggressively:
root@siren:/proc/sys/vm# cat dirty_ratio
20
root@siren:/proc/sys/vm# cat dirty_background_ratio
10
Reducing percentages
To confirm the setting operated as expected, the OSM loading was re-run with decreased percentage values like this:
root@siren:~# echo 10 > /proc/sys/vm/dirty_ratio
root@siren:~# echo 5 > /proc/sys/vm/dirty_background_ratio
The percentage parameters worked as expected:
| Settings | Max Dirty |
|---|---|
| 10/20 | 13GB |
| 5/10 | 7.5GB |
| 2/4 | 2.6GB |
| 1/2 | 1.3GB |
Reducing with byte guidance
On systems with a lot of memory, even 1% can be too large. Modern kernels allow setting the value in bytes instead. This example aims at a 1000MB/500MB split:
root@siren:~# echo 1000000000 > /proc/sys/vm/dirty_bytes
root@siren:~# echo  500000000 > /proc/sys/vm/dirty_background_bytes
Note that after setting a bytes value, dirty_ratio and dirty_background_ratio will report 0:
root@siren:~# cat /proc/sys/vm/dirty_ratio
0
root@siren:~# cat /proc/sys/vm/dirty_background_ratio
0
The bytes settings workes as expected too:
| Settings | Max Dirty |
|---|---|
| 1000MB/500MB | 947MB |
| 500MB/250MB | 459MB |
| 100MB/50MB | 95MB |